
 Yahoo Finance
 Returns On Capital Signal Tricky Times Ahead For Thakral (SGX:AWI)
What are the early trends we should look for to identify a stock that could multiply in value over the long term? One common approach is to try and find a company with returns on capital employed (ROCE) that are increasing, in conjunction with a growing amount of capital employed. If you see this, it typically means it's a company with a great business model and plenty of profitable reinvestment opportunities. Having said that, from a first glance at Thakral (SGX:AWI) we aren't jumping out of our chairs at how returns are trending, but let's have a deeper look.
What Is Return On Capital Employed (ROCE)?
For those that aren't sure what ROCE is, it measures the amount of pre-tax profits a company can generate from the capital employed in its business. Analysts use this formula to calculate it for Thakral:
Return on Capital Employed = Earnings Before Interest and Tax (EBIT) ÷ (Total Assets - Current Liabilities)
0.018 = S$5.0m ÷ (S$367m - S$89m) (Based on the trailing twelve months to June 2023).
Thus, Thakral has an ROCE of 1.8%. Ultimately, that's a low return and it under-performs the Retail Distributors industry average of 5.0%.
View our latest analysis for Thakral
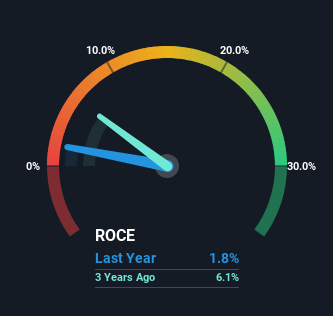
Historical performance is a great place to start when researching a stock so above you can see the gauge for Thakral's ROCE against it's prior returns. If you want to delve into the historical earnings, revenue and cash flow of Thakral, check out these free graphs here.
So How Is Thakral's ROCE Trending?
In terms of Thakral's historical ROCE movements, the trend isn't fantastic. Over the last five years, returns on capital have decreased to 1.8% from 14% five years ago. Although, given both revenue and the amount of assets employed in the business have increased, it could suggest the company is investing in growth, and the extra capital has led to a short-term reduction in ROCE. If these investments prove successful, this can bode very well for long term stock performance.
The Bottom Line
In summary, despite lower returns in the short term, we're encouraged to see that Thakral is reinvesting for growth and has higher sales as a result. And the stock has done incredibly well with a 101% return over the last five years, so long term investors are no doubt ecstatic with that result. So should these growth trends continue, we'd be optimistic on the stock going forward.
One more thing, we've spotted 2 warning signs facing Thakral that you might find interesting.
While Thakral may not currently earn the highest returns, we've compiled a list of companies that currently earn more than 25% return on equity. Check out this free list here.
Have feedback on this article? Concerned about the content? Get in touch with us directly. Alternatively, email editorial-team (at) simplywallst.com.
This article by Simply Wall St is general in nature. We provide commentary based on historical data and analyst forecasts only using an unbiased methodology and our articles are not intended to be financial advice. It does not constitute a recommendation to buy or sell any stock, and does not take account of your objectives, or your financial situation. We aim to bring you long-term focused analysis driven by fundamental data. Note that our analysis may not factor in the latest price-sensitive company announcements or qualitative material. Simply Wall St has no position in any stocks mentioned.
