
 Yahoo Finance
 Returns On Capital Signal Tricky Times Ahead For Algoma Steel Group (NASDAQ:ASTL)
If you're not sure where to start when looking for the next multi-bagger, there are a few key trends you should keep an eye out for. Ideally, a business will show two trends; firstly a growing return on capital employed (ROCE) and secondly, an increasing amount of capital employed. Ultimately, this demonstrates that it's a business that is reinvesting profits at increasing rates of return. However, after investigating Algoma Steel Group (NASDAQ:ASTL), we don't think it's current trends fit the mold of a multi-bagger.
What Is Return On Capital Employed (ROCE)?
If you haven't worked with ROCE before, it measures the 'return' (pre-tax profit) a company generates from capital employed in its business. To calculate this metric for Algoma Steel Group, this is the formula:
Return on Capital Employed = Earnings Before Interest and Tax (EBIT) ÷ (Total Assets - Current Liabilities)
0.07 = CA$154m ÷ (CA$2.7b - CA$467m) (Based on the trailing twelve months to December 2023).
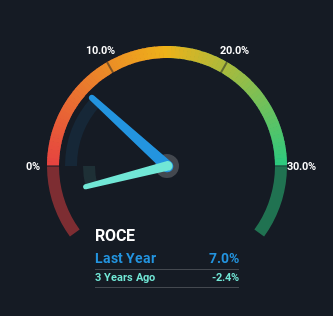
So, Algoma Steel Group has an ROCE of 7.0%. In absolute terms, that's a low return and it also under-performs the Metals and Mining industry average of 9.1%.
Check out our latest analysis for Algoma Steel Group
Above you can see how the current ROCE for Algoma Steel Group compares to its prior returns on capital, but there's only so much you can tell from the past. If you're interested, you can view the analysts predictions in our free analyst report for Algoma Steel Group .
What The Trend Of ROCE Can Tell Us
When we looked at the ROCE trend at Algoma Steel Group, we didn't gain much confidence. Around five years ago the returns on capital were 23%, but since then they've fallen to 7.0%. On the other hand, the company has been employing more capital without a corresponding improvement in sales in the last year, which could suggest these investments are longer term plays. It's worth keeping an eye on the company's earnings from here on to see if these investments do end up contributing to the bottom line.
On a related note, Algoma Steel Group has decreased its current liabilities to 18% of total assets. So we could link some of this to the decrease in ROCE. What's more, this can reduce some aspects of risk to the business because now the company's suppliers or short-term creditors are funding less of its operations. Some would claim this reduces the business' efficiency at generating ROCE since it is now funding more of the operations with its own money.
The Key Takeaway
To conclude, we've found that Algoma Steel Group is reinvesting in the business, but returns have been falling. Since the stock has declined 12% over the last three years, investors may not be too optimistic on this trend improving either. All in all, the inherent trends aren't typical of multi-baggers, so if that's what you're after, we think you might have more luck elsewhere.
On a final note, we've found 3 warning signs for Algoma Steel Group that we think you should be aware of.
If you want to search for solid companies with great earnings, check out this free list of companies with good balance sheets and impressive returns on equity.
Have feedback on this article? Concerned about the content? Get in touch with us directly. Alternatively, email editorial-team (at) simplywallst.com.
This article by Simply Wall St is general in nature. We provide commentary based on historical data and analyst forecasts only using an unbiased methodology and our articles are not intended to be financial advice. It does not constitute a recommendation to buy or sell any stock, and does not take account of your objectives, or your financial situation. We aim to bring you long-term focused analysis driven by fundamental data. Note that our analysis may not factor in the latest price-sensitive company announcements or qualitative material. Simply Wall St has no position in any stocks mentioned.
