
 Yahoo Finance
 Returns On Capital Signal Tricky Times Ahead For Resources Connection (NASDAQ:RGP)
Did you know there are some financial metrics that can provide clues of a potential multi-bagger? Firstly, we'll want to see a proven return on capital employed (ROCE) that is increasing, and secondly, an expanding base of capital employed. Basically this means that a company has profitable initiatives that it can continue to reinvest in, which is a trait of a compounding machine. Having said that, from a first glance at Resources Connection (NASDAQ:RGP) we aren't jumping out of our chairs at how returns are trending, but let's have a deeper look.
Understanding Return On Capital Employed (ROCE)
If you haven't worked with ROCE before, it measures the 'return' (pre-tax profit) a company generates from capital employed in its business. Analysts use this formula to calculate it for Resources Connection:
Return on Capital Employed = Earnings Before Interest and Tax (EBIT) ÷ (Total Assets - Current Liabilities)
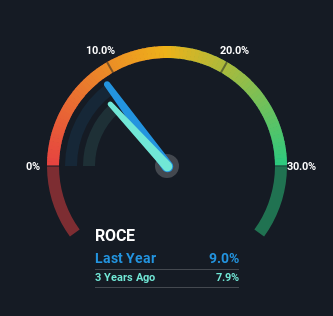
0.09 = US$39m ÷ (US$523m - US$84m) (Based on the trailing twelve months to February 2024).
Thus, Resources Connection has an ROCE of 9.0%. Ultimately, that's a low return and it under-performs the Professional Services industry average of 14%.
View our latest analysis for Resources Connection
In the above chart we have measured Resources Connection's prior ROCE against its prior performance, but the future is arguably more important. If you're interested, you can view the analysts predictions in our free analyst report for Resources Connection .
What The Trend Of ROCE Can Tell Us
When we looked at the ROCE trend at Resources Connection, we didn't gain much confidence. To be more specific, ROCE has fallen from 13% over the last five years. And considering revenue has dropped while employing more capital, we'd be cautious. If this were to continue, you might be looking at a company that is trying to reinvest for growth but is actually losing market share since sales haven't increased.
The Bottom Line
We're a bit apprehensive about Resources Connection because despite more capital being deployed in the business, returns on that capital and sales have both fallen. It should come as no surprise then that the stock has fallen 12% over the last five years, so it looks like investors are recognizing these changes. Unless there is a shift to a more positive trajectory in these metrics, we would look elsewhere.
On a separate note, we've found 1 warning sign for Resources Connection you'll probably want to know about.
If you want to search for solid companies with great earnings, check out this free list of companies with good balance sheets and impressive returns on equity.
Have feedback on this article? Concerned about the content? Get in touch with us directly. Alternatively, email editorial-team (at) simplywallst.com.
This article by Simply Wall St is general in nature. We provide commentary based on historical data and analyst forecasts only using an unbiased methodology and our articles are not intended to be financial advice. It does not constitute a recommendation to buy or sell any stock, and does not take account of your objectives, or your financial situation. We aim to bring you long-term focused analysis driven by fundamental data. Note that our analysis may not factor in the latest price-sensitive company announcements or qualitative material. Simply Wall St has no position in any stocks mentioned.
