
 Yahoo Finance
 Returns On Capital Are Showing Encouraging Signs At Raffles Education (SGX:NR7)
Finding a business that has the potential to grow substantially is not easy, but it is possible if we look at a few key financial metrics. Firstly, we'll want to see a proven return on capital employed (ROCE) that is increasing, and secondly, an expanding base of capital employed. Put simply, these types of businesses are compounding machines, meaning they are continually reinvesting their earnings at ever-higher rates of return. Speaking of which, we noticed some great changes in Raffles Education's (SGX:NR7) returns on capital, so let's have a look.
Return On Capital Employed (ROCE): What Is It?
Just to clarify if you're unsure, ROCE is a metric for evaluating how much pre-tax income (in percentage terms) a company earns on the capital invested in its business. The formula for this calculation on Raffles Education is:
Return on Capital Employed = Earnings Before Interest and Tax (EBIT) ÷ (Total Assets - Current Liabilities)
0.012 = S$11m ÷ (S$1.2b - S$270m) (Based on the trailing twelve months to June 2023).
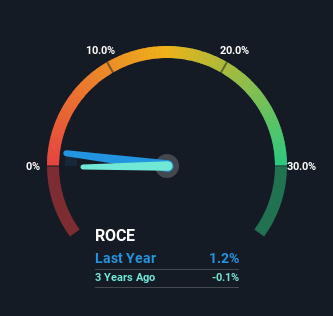
Thus, Raffles Education has an ROCE of 1.2%. In absolute terms, that's a low return and it also under-performs the Consumer Services industry average of 9.0%.
View our latest analysis for Raffles Education
While the past is not representative of the future, it can be helpful to know how a company has performed historically, which is why we have this chart above. If you want to delve into the historical earnings , check out these free graphs detailing revenue and cash flow performance of Raffles Education.
How Are Returns Trending?
Shareholders will be relieved that Raffles Education has broken into profitability. While the business was unprofitable in the past, it's now turned things around and is earning 1.2% on its capital. While returns have increased, the amount of capital employed by Raffles Education has remained flat over the period. That being said, while an increase in efficiency is no doubt appealing, it'd be helpful to know if the company does have any investment plans going forward. Because in the end, a business can only get so efficient.
What We Can Learn From Raffles Education's ROCE
In summary, we're delighted to see that Raffles Education has been able to increase efficiencies and earn higher rates of return on the same amount of capital. And since the stock has fallen 44% over the last five years, there might be an opportunity here. So researching this company further and determining whether or not these trends will continue seems justified.
On a final note, we found 2 warning signs for Raffles Education (1 is a bit concerning) you should be aware of.
If you want to search for solid companies with great earnings, check out this free list of companies with good balance sheets and impressive returns on equity.
Have feedback on this article? Concerned about the content? Get in touch with us directly. Alternatively, email editorial-team (at) simplywallst.com.
This article by Simply Wall St is general in nature. We provide commentary based on historical data and analyst forecasts only using an unbiased methodology and our articles are not intended to be financial advice. It does not constitute a recommendation to buy or sell any stock, and does not take account of your objectives, or your financial situation. We aim to bring you long-term focused analysis driven by fundamental data. Note that our analysis may not factor in the latest price-sensitive company announcements or qualitative material. Simply Wall St has no position in any stocks mentioned.
