
 Yahoo Finance
 Returns On Capital At Lynas Rare Earths (ASX:LYC) Have Stalled
If we want to find a stock that could multiply over the long term, what are the underlying trends we should look for? In a perfect world, we'd like to see a company investing more capital into its business and ideally the returns earned from that capital are also increasing. Put simply, these types of businesses are compounding machines, meaning they are continually reinvesting their earnings at ever-higher rates of return. However, after investigating Lynas Rare Earths (ASX:LYC), we don't think it's current trends fit the mold of a multi-bagger.
Return On Capital Employed (ROCE): What Is It?
Just to clarify if you're unsure, ROCE is a metric for evaluating how much pre-tax income (in percentage terms) a company earns on the capital invested in its business. The formula for this calculation on Lynas Rare Earths is:
Return on Capital Employed = Earnings Before Interest and Tax (EBIT) ÷ (Total Assets - Current Liabilities)
0.062 = AU$159m ÷ (AU$2.7b - AU$142m) (Based on the trailing twelve months to December 2023).
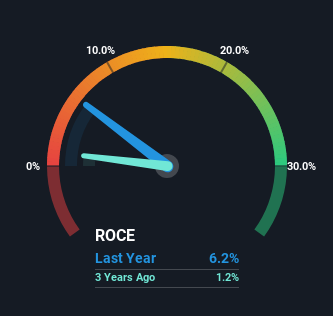
So, Lynas Rare Earths has an ROCE of 6.2%. Ultimately, that's a low return and it under-performs the Metals and Mining industry average of 11%.
View our latest analysis for Lynas Rare Earths
In the above chart we have measured Lynas Rare Earths' prior ROCE against its prior performance, but the future is arguably more important. If you'd like to see what analysts are forecasting going forward, you should check out our free analyst report for Lynas Rare Earths .
What Can We Tell From Lynas Rare Earths' ROCE Trend?
The returns on capital haven't changed much for Lynas Rare Earths in recent years. The company has consistently earned 6.2% for the last five years, and the capital employed within the business has risen 235% in that time. Given the company has increased the amount of capital employed, it appears the investments that have been made simply don't provide a high return on capital.
What We Can Learn From Lynas Rare Earths' ROCE
Long story short, while Lynas Rare Earths has been reinvesting its capital, the returns that it's generating haven't increased. Investors must think there's better things to come because the stock has knocked it out of the park, delivering a 139% gain to shareholders who have held over the last five years. But if the trajectory of these underlying trends continue, we think the likelihood of it being a multi-bagger from here isn't high.
If you want to know some of the risks facing Lynas Rare Earths we've found 2 warning signs (1 is a bit concerning!) that you should be aware of before investing here.
If you want to search for solid companies with great earnings, check out this free list of companies with good balance sheets and impressive returns on equity.
Have feedback on this article? Concerned about the content? Get in touch with us directly. Alternatively, email editorial-team (at) simplywallst.com.
This article by Simply Wall St is general in nature. We provide commentary based on historical data and analyst forecasts only using an unbiased methodology and our articles are not intended to be financial advice. It does not constitute a recommendation to buy or sell any stock, and does not take account of your objectives, or your financial situation. We aim to bring you long-term focused analysis driven by fundamental data. Note that our analysis may not factor in the latest price-sensitive company announcements or qualitative material. Simply Wall St has no position in any stocks mentioned.
Have feedback on this article? Concerned about the content? Get in touch with us directly. Alternatively, email editorial-team@simplywallst.com
