
 Yahoo Finance
 Returns On Capital At Darco Water Technologies (SGX:BLR) Have Stalled
If you're looking for a multi-bagger, there's a few things to keep an eye out for. Ideally, a business will show two trends; firstly a growing return on capital employed (ROCE) and secondly, an increasing amount of capital employed. This shows us that it's a compounding machine, able to continually reinvest its earnings back into the business and generate higher returns. Although, when we looked at Darco Water Technologies (SGX:BLR), it didn't seem to tick all of these boxes.
Understanding Return On Capital Employed (ROCE)
If you haven't worked with ROCE before, it measures the 'return' (pre-tax profit) a company generates from capital employed in its business. To calculate this metric for Darco Water Technologies, this is the formula:
Return on Capital Employed = Earnings Before Interest and Tax (EBIT) ÷ (Total Assets - Current Liabilities)
0.026 = S$1.2m ÷ (S$84m - S$40m) (Based on the trailing twelve months to June 2023).
Thus, Darco Water Technologies has an ROCE of 2.6%. In absolute terms, that's a low return and it also under-performs the Machinery industry average of 6.8%.
View our latest analysis for Darco Water Technologies
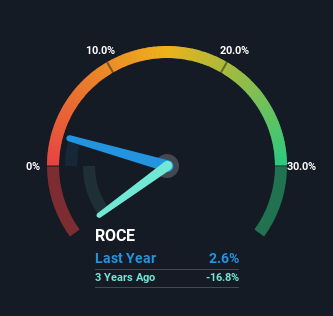
Historical performance is a great place to start when researching a stock so above you can see the gauge for Darco Water Technologies' ROCE against it's prior returns. If you want to delve into the historical earnings, revenue and cash flow of Darco Water Technologies, check out these free graphs here.
What Does the ROCE Trend For Darco Water Technologies Tell Us?
We're a bit concerned with the trends, because the business is applying 26% less capital than it was five years ago and returns on that capital have stayed flat. This indicates to us that assets are being sold and thus the business is likely shrinking, which you'll remember isn't the typical ingredients for an up-and-coming multi-bagger. Not only that, but the low returns on this capital mentioned earlier would leave most investors unimpressed.
Another thing to note, Darco Water Technologies has a high ratio of current liabilities to total assets of 48%. This can bring about some risks because the company is basically operating with a rather large reliance on its suppliers or other sorts of short-term creditors. Ideally we'd like to see this reduce as that would mean fewer obligations bearing risks.
What We Can Learn From Darco Water Technologies' ROCE
In summary, Darco Water Technologies isn't reinvesting funds back into the business and returns aren't growing. Since the stock has declined 24% over the last three years, investors may not be too optimistic on this trend improving either. In any case, the stock doesn't have these traits of a multi-bagger discussed above, so if that's what you're looking for, we think you'd have more luck elsewhere.
One more thing to note, we've identified 3 warning signs with Darco Water Technologies and understanding these should be part of your investment process.
While Darco Water Technologies isn't earning the highest return, check out this free list of companies that are earning high returns on equity with solid balance sheets.
Have feedback on this article? Concerned about the content? Get in touch with us directly. Alternatively, email editorial-team (at) simplywallst.com.
This article by Simply Wall St is general in nature. We provide commentary based on historical data and analyst forecasts only using an unbiased methodology and our articles are not intended to be financial advice. It does not constitute a recommendation to buy or sell any stock, and does not take account of your objectives, or your financial situation. We aim to bring you long-term focused analysis driven by fundamental data. Note that our analysis may not factor in the latest price-sensitive company announcements or qualitative material. Simply Wall St has no position in any stocks mentioned.
