
 Yahoo Finance
 The Returns On Capital At China Sunsine Chemical Holdings (SGX:QES) Don't Inspire Confidence
What are the early trends we should look for to identify a stock that could multiply in value over the long term? One common approach is to try and find a company with returns on capital employed (ROCE) that are increasing, in conjunction with a growing amount of capital employed. Ultimately, this demonstrates that it's a business that is reinvesting profits at increasing rates of return. In light of that, when we looked at China Sunsine Chemical Holdings (SGX:QES) and its ROCE trend, we weren't exactly thrilled.
Understanding Return On Capital Employed (ROCE)
Just to clarify if you're unsure, ROCE is a metric for evaluating how much pre-tax income (in percentage terms) a company earns on the capital invested in its business. The formula for this calculation on China Sunsine Chemical Holdings is:
Return on Capital Employed = Earnings Before Interest and Tax (EBIT) ÷ (Total Assets - Current Liabilities)
0.11 = CN¥419m ÷ (CN¥4.2b - CN¥434m) (Based on the trailing twelve months to June 2023).
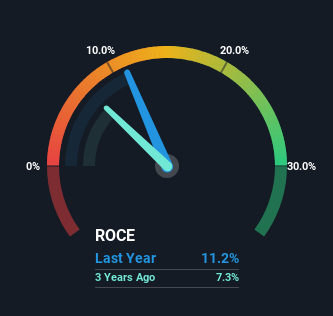
Therefore, China Sunsine Chemical Holdings has an ROCE of 11%. On its own, that's a standard return, however it's much better than the 1.8% generated by the Chemicals industry.
View our latest analysis for China Sunsine Chemical Holdings
In the above chart we have measured China Sunsine Chemical Holdings' prior ROCE against its prior performance, but the future is arguably more important. If you'd like, you can check out the forecasts from the analysts covering China Sunsine Chemical Holdings here for free.
So How Is China Sunsine Chemical Holdings' ROCE Trending?
On the surface, the trend of ROCE at China Sunsine Chemical Holdings doesn't inspire confidence. To be more specific, ROCE has fallen from 33% over the last five years. And considering revenue has dropped while employing more capital, we'd be cautious. This could mean that the business is losing its competitive advantage or market share, because while more money is being put into ventures, it's actually producing a lower return - "less bang for their buck" per se.
In Conclusion...
We're a bit apprehensive about China Sunsine Chemical Holdings because despite more capital being deployed in the business, returns on that capital and sales have both fallen. Investors haven't taken kindly to these developments, since the stock has declined 24% from where it was five years ago. Unless there is a shift to a more positive trajectory in these metrics, we would look elsewhere.
If you want to continue researching China Sunsine Chemical Holdings, you might be interested to know about the 2 warning signs that our analysis has discovered.
For those who like to invest in solid companies, check out this free list of companies with solid balance sheets and high returns on equity.
Have feedback on this article? Concerned about the content? Get in touch with us directly. Alternatively, email editorial-team (at) simplywallst.com.
This article by Simply Wall St is general in nature. We provide commentary based on historical data and analyst forecasts only using an unbiased methodology and our articles are not intended to be financial advice. It does not constitute a recommendation to buy or sell any stock, and does not take account of your objectives, or your financial situation. We aim to bring you long-term focused analysis driven by fundamental data. Note that our analysis may not factor in the latest price-sensitive company announcements or qualitative material. Simply Wall St has no position in any stocks mentioned.
