
 Yahoo Finance
 The Returns On Capital At Berentzen-Gruppe (ETR:BEZ) Don't Inspire Confidence
If you're looking at a mature business that's past the growth phase, what are some of the underlying trends that pop up? A business that's potentially in decline often shows two trends, a return on capital employed (ROCE) that's declining, and a base of capital employed that's also declining. This combination can tell you that not only is the company investing less, it's earning less on what it does invest. And from a first read, things don't look too good at Berentzen-Gruppe (ETR:BEZ), so let's see why.
What Is Return On Capital Employed (ROCE)?
For those that aren't sure what ROCE is, it measures the amount of pre-tax profits a company can generate from the capital employed in its business. The formula for this calculation on Berentzen-Gruppe is:
Return on Capital Employed = Earnings Before Interest and Tax (EBIT) ÷ (Total Assets - Current Liabilities)
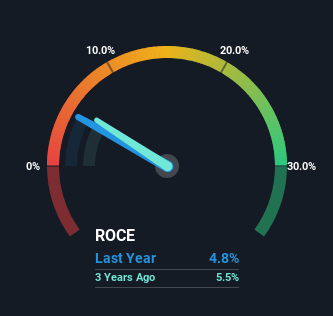
0.048 = €3.3m ÷ (€145m - €77m) (Based on the trailing twelve months to December 2023).
Thus, Berentzen-Gruppe has an ROCE of 4.8%. On its own, that's a low figure but it's around the 5.9% average generated by the Beverage industry.
Check out our latest analysis for Berentzen-Gruppe
Above you can see how the current ROCE for Berentzen-Gruppe compares to its prior returns on capital, but there's only so much you can tell from the past. If you're interested, you can view the analysts predictions in our free analyst report for Berentzen-Gruppe .
How Are Returns Trending?
In terms of Berentzen-Gruppe's historical ROCE movements, the trend doesn't inspire confidence. About five years ago, returns on capital were 9.7%, however they're now substantially lower than that as we saw above. On top of that, it's worth noting that the amount of capital employed within the business has remained relatively steady. Companies that exhibit these attributes tend to not be shrinking, but they can be mature and facing pressure on their margins from competition. So because these trends aren't typically conducive to creating a multi-bagger, we wouldn't hold our breath on Berentzen-Gruppe becoming one if things continue as they have.
On a side note, Berentzen-Gruppe's current liabilities are still rather high at 53% of total assets. This effectively means that suppliers (or short-term creditors) are funding a large portion of the business, so just be aware that this can introduce some elements of risk. Ideally we'd like to see this reduce as that would mean fewer obligations bearing risks.
The Bottom Line
All in all, the lower returns from the same amount of capital employed aren't exactly signs of a compounding machine. And long term shareholders have watched their investments stay flat over the last five years. Unless there is a shift to a more positive trajectory in these metrics, we would look elsewhere.
One final note, you should learn about the 4 warning signs we've spotted with Berentzen-Gruppe (including 2 which don't sit too well with us) .
While Berentzen-Gruppe may not currently earn the highest returns, we've compiled a list of companies that currently earn more than 25% return on equity. Check out this free list here.
Have feedback on this article? Concerned about the content? Get in touch with us directly. Alternatively, email editorial-team (at) simplywallst.com.
This article by Simply Wall St is general in nature. We provide commentary based on historical data and analyst forecasts only using an unbiased methodology and our articles are not intended to be financial advice. It does not constitute a recommendation to buy or sell any stock, and does not take account of your objectives, or your financial situation. We aim to bring you long-term focused analysis driven by fundamental data. Note that our analysis may not factor in the latest price-sensitive company announcements or qualitative material. Simply Wall St has no position in any stocks mentioned.
