
 Yahoo Finance
 The Returns At Anexo Group (LON:ANX) Aren't Growing
What trends should we look for it we want to identify stocks that can multiply in value over the long term? Firstly, we'd want to identify a growing return on capital employed (ROCE) and then alongside that, an ever-increasing base of capital employed. Basically this means that a company has profitable initiatives that it can continue to reinvest in, which is a trait of a compounding machine. With that in mind, the ROCE of Anexo Group (LON:ANX) looks decent, right now, so lets see what the trend of returns can tell us.
Understanding Return On Capital Employed (ROCE)
For those who don't know, ROCE is a measure of a company's yearly pre-tax profit (its return), relative to the capital employed in the business. To calculate this metric for Anexo Group, this is the formula:
Return on Capital Employed = Earnings Before Interest and Tax (EBIT) ÷ (Total Assets - Current Liabilities)
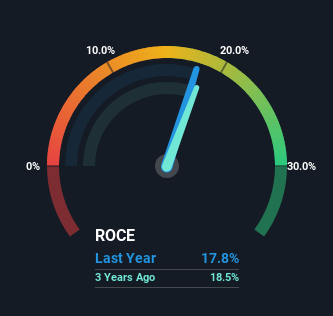
0.18 = UK£34m ÷ (UK£254m - UK£66m) (Based on the trailing twelve months to June 2023).
So, Anexo Group has an ROCE of 18%. On its own, that's a standard return, however it's much better than the 10% generated by the Consumer Services industry.
View our latest analysis for Anexo Group
Above you can see how the current ROCE for Anexo Group compares to its prior returns on capital, but there's only so much you can tell from the past. If you'd like to see what analysts are forecasting going forward, you should check out our free analyst report for Anexo Group .
So How Is Anexo Group's ROCE Trending?
While the returns on capital are good, they haven't moved much. The company has consistently earned 18% for the last five years, and the capital employed within the business has risen 154% in that time. 18% is a pretty standard return, and it provides some comfort knowing that Anexo Group has consistently earned this amount. Stable returns in this ballpark can be unexciting, but if they can be maintained over the long run, they often provide nice rewards to shareholders.
Our Take On Anexo Group's ROCE
To sum it up, Anexo Group has simply been reinvesting capital steadily, at those decent rates of return. Yet over the last five years the stock has declined 44%, so the decline might provide an opening. That's why we think it'd be worthwhile to look further into this stock given the fundamentals are appealing.
If you want to know some of the risks facing Anexo Group we've found 4 warning signs (1 is potentially serious!) that you should be aware of before investing here.
While Anexo Group may not currently earn the highest returns, we've compiled a list of companies that currently earn more than 25% return on equity. Check out this free list here.
Have feedback on this article? Concerned about the content? Get in touch with us directly. Alternatively, email editorial-team (at) simplywallst.com.
This article by Simply Wall St is general in nature. We provide commentary based on historical data and analyst forecasts only using an unbiased methodology and our articles are not intended to be financial advice. It does not constitute a recommendation to buy or sell any stock, and does not take account of your objectives, or your financial situation. We aim to bring you long-term focused analysis driven by fundamental data. Note that our analysis may not factor in the latest price-sensitive company announcements or qualitative material. Simply Wall St has no position in any stocks mentioned.
