
 Yahoo Finance
 The Return Trends At Kirby (NYSE:KEX) Look Promising
Finding a business that has the potential to grow substantially is not easy, but it is possible if we look at a few key financial metrics. Typically, we'll want to notice a trend of growing return on capital employed (ROCE) and alongside that, an expanding base of capital employed. Ultimately, this demonstrates that it's a business that is reinvesting profits at increasing rates of return. Speaking of which, we noticed some great changes in Kirby's (NYSE:KEX) returns on capital, so let's have a look.
What Is Return On Capital Employed (ROCE)?
For those who don't know, ROCE is a measure of a company's yearly pre-tax profit (its return), relative to the capital employed in the business. Analysts use this formula to calculate it for Kirby:
Return on Capital Employed = Earnings Before Interest and Tax (EBIT) ÷ (Total Assets - Current Liabilities)
0.075 = US$377m ÷ (US$5.7b - US$676m) (Based on the trailing twelve months to March 2024).
Thus, Kirby has an ROCE of 7.5%. On its own, that's a low figure but it's around the 7.7% average generated by the Shipping industry.
Check out our latest analysis for Kirby
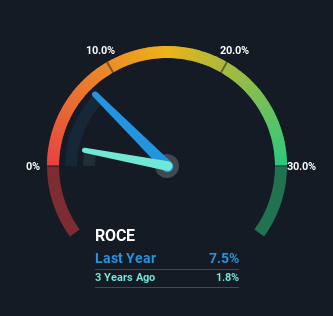
Above you can see how the current ROCE for Kirby compares to its prior returns on capital, but there's only so much you can tell from the past. If you're interested, you can view the analysts predictions in our free analyst report for Kirby .
So How Is Kirby's ROCE Trending?
Kirby is showing promise given that its ROCE is trending up and to the right. The figures show that over the last five years, ROCE has grown 48% whilst employing roughly the same amount of capital. Basically the business is generating higher returns from the same amount of capital and that is proof that there are improvements in the company's efficiencies. On that front, things are looking good so it's worth exploring what management has said about growth plans going forward.
The Bottom Line
In summary, we're delighted to see that Kirby has been able to increase efficiencies and earn higher rates of return on the same amount of capital. Since the stock has only returned 32% to shareholders over the last five years, the promising fundamentals may not be recognized yet by investors. So with that in mind, we think the stock deserves further research.
One more thing to note, we've identified 1 warning sign with Kirby and understanding it should be part of your investment process.
While Kirby may not currently earn the highest returns, we've compiled a list of companies that currently earn more than 25% return on equity. Check out this free list here.
Have feedback on this article? Concerned about the content? Get in touch with us directly. Alternatively, email editorial-team (at) simplywallst.com.
This article by Simply Wall St is general in nature. We provide commentary based on historical data and analyst forecasts only using an unbiased methodology and our articles are not intended to be financial advice. It does not constitute a recommendation to buy or sell any stock, and does not take account of your objectives, or your financial situation. We aim to bring you long-term focused analysis driven by fundamental data. Note that our analysis may not factor in the latest price-sensitive company announcements or qualitative material. Simply Wall St has no position in any stocks mentioned.
