
 Yahoo Finance
 The Return Trends At Civmec (SGX:P9D) Look Promising
What are the early trends we should look for to identify a stock that could multiply in value over the long term? Amongst other things, we'll want to see two things; firstly, a growing return on capital employed (ROCE) and secondly, an expansion in the company's amount of capital employed. This shows us that it's a compounding machine, able to continually reinvest its earnings back into the business and generate higher returns. So on that note, Civmec (SGX:P9D) looks quite promising in regards to its trends of return on capital.
What Is Return On Capital Employed (ROCE)?
Just to clarify if you're unsure, ROCE is a metric for evaluating how much pre-tax income (in percentage terms) a company earns on the capital invested in its business. Analysts use this formula to calculate it for Civmec:
Return on Capital Employed = Earnings Before Interest and Tax (EBIT) ÷ (Total Assets - Current Liabilities)
0.15 = AU$89m ÷ (AU$808m - AU$197m) (Based on the trailing twelve months to December 2023).
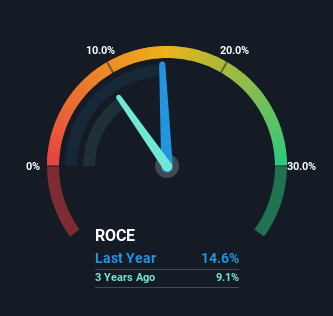
Thus, Civmec has an ROCE of 15%. In absolute terms, that's a satisfactory return, but compared to the Construction industry average of 6.5% it's much better.
Check out our latest analysis for Civmec
In the above chart we have measured Civmec's prior ROCE against its prior performance, but the future is arguably more important. If you'd like to see what analysts are forecasting going forward, you should check out our free analyst report for Civmec .
The Trend Of ROCE
Investors would be pleased with what's happening at Civmec. The numbers show that in the last five years, the returns generated on capital employed have grown considerably to 15%. The amount of capital employed has increased too, by 105%. This can indicate that there's plenty of opportunities to invest capital internally and at ever higher rates, a combination that's common among multi-baggers.
One more thing to note, Civmec has decreased current liabilities to 24% of total assets over this period, which effectively reduces the amount of funding from suppliers or short-term creditors. So shareholders would be pleased that the growth in returns has mostly come from underlying business performance.
The Bottom Line On Civmec's ROCE
A company that is growing its returns on capital and can consistently reinvest in itself is a highly sought after trait, and that's what Civmec has. Since the stock has returned a staggering 139% to shareholders over the last five years, it looks like investors are recognizing these changes. So given the stock has proven it has promising trends, it's worth researching the company further to see if these trends are likely to persist.
While Civmec looks impressive, no company is worth an infinite price. The intrinsic value infographic for P9D helps visualize whether it is currently trading for a fair price.
While Civmec may not currently earn the highest returns, we've compiled a list of companies that currently earn more than 25% return on equity. Check out this free list here.
Have feedback on this article? Concerned about the content? Get in touch with us directly. Alternatively, email editorial-team (at) simplywallst.com.
This article by Simply Wall St is general in nature. We provide commentary based on historical data and analyst forecasts only using an unbiased methodology and our articles are not intended to be financial advice. It does not constitute a recommendation to buy or sell any stock, and does not take account of your objectives, or your financial situation. We aim to bring you long-term focused analysis driven by fundamental data. Note that our analysis may not factor in the latest price-sensitive company announcements or qualitative material. Simply Wall St has no position in any stocks mentioned.
