
 Yahoo Finance
 Regency Centers (REG) Q4 FFO Misses Estimates, Revenues Beat

Regency Centers Corporation’s REG fourth-quarter 2021 NAREIT funds from operations (FFO) per share were$1.01. However, adjusted FFO per share came in at 92 cents, which missed the Zacks Consensus Estimate of 96 cents.
On a year-over-year basis, NAREIT (FFO) per share compared favorably with the prior-year period’s 76 cents.
The quarterly results reflect higher-than-anticipated revenue numbers.
Total revenues of $296.9 million exceeded the Zacks Consensus Estimate of $287.9 million. Moreover, revenues jumped 14.9% from the year-earlier quarter’s figure.
For 2021, Regency Centers reported an FFO per share of $3.68, up 23.9% from the prior year’s $2.97. However, the figure lagged the Zacks Consensus Estimate of $3.90. Total revenues of $1.16 billion were up 14.8% year over year.
As of Feb 7, Regency Centers collected 99% of the fourth-quarter pro-rata base rent.
Inside the Headlines
During the fourth quarter, Regency Centers executed 1.8 million square feet of comparable new and renewal leases with blended rent spreads of 12.9%.
As of Dec 31, 2021, REG’s wholly-owned portfolio and its pro-rata shares of co-investment partnerships were94.1% leased. Its same-property portfolio was 94.3% leased, reflecting an expansion of 50 basis points (bps), sequentially.
In the same-property portfolio, anchor percent leased (includes spaces greater than or equal to 10,000 square feet) was 96.9%, highlighting an expansion of 40 bps, sequentially, while the same-property shop percent leased (includes spaces less than 10,000 square feet) was 89.9%, marking an expansion of 60 bps quarter over quarter.
The same-property NOI, excluding termination fees, climbed 15.4% on a year-over-year basis.
Portfolio Activity
During the fourth quarter, Regency Centers completed one development project and three redevelopment projects with combined costs of approximately $23 million, at the company’s share.
As of Dec 31, 2021, Regency Centers’ in-process development and redevelopment projects had estimated net project costs of $307 million and an estimated $127 million of remaining costs to complete these projects, each at the company’s share.
Liquidity Update
As of Dec 31, 2021, Regency Centers had cash, cash equivalents and restricted cash of $95 million, down from $378.5 million at 2020 end. The retail REIT had full capacity under its $1.2-billion revolving credit facility. As of that date, its pro-rata net debt-to-operating EBITDAre ratio was 5.1X compared with 6.0Xas of Dec 31, 2020.
Outlook
Regency Centers provided initial 2022 guidance. Management projects the current-year NAREIT FFO per share in the range of $3.72-$3.80. The range is below the Zacks Consensus Estimate, currently pegged at $3.90.
Management also expects the same-property NOI (excluding termination fees) in the guided range of -1.25-0.25%.
Dividend Update
On Feb 9, Regency Centers’ board of directors announced a quarterly cash dividend of 62.5 cents per share on its common stock. The dividend will be paid out on Apr 5 to its shareholders of record as of Mar 15, 2022.
Regency Centers currently carries a Zacks Rank #3 (Hold). You can see the complete list of today’s Zacks #1 Rank (Strong Buy) stocks here.
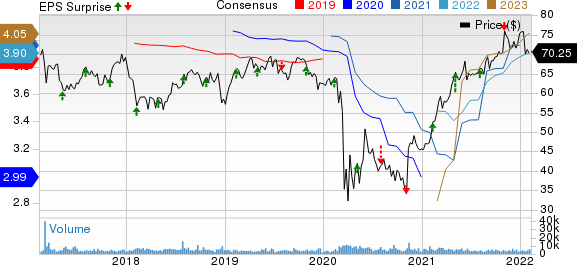
Regency Centers Corporation Price, Consensus and EPS Surprise
Regency Centers Corporation price-consensus-eps-surprise-chart | Regency Centers Corporation Quote
Performance of Other REITs
Alexandria Real Estate Equities, Inc. ARE reported an adjusted FFO of $1.97 per share for fourth-quarter 2021, up 7.1% from the year-ago quarter’s $1.84. The figure surpassed the Zacks Consensus Estimate of $1.96.
The year-over-year improvement in ARE’s FFO resulted from 24.4% top-line growth to $576.9 million. Results reflected decent internal growth. Alexandria witnessed a continued healthy leasing activity and rental rate growth during the quarter.
Mid-America Apartment Communities, Inc. MAA, commonly referred to as MAA, reported fourth-quarter 2021 core FFO per share of $1.90, surpassing the Zacks Consensus Estimate of $1.87. The reported number increased 15.2% from the year-ago figure of $1.57.
MAA’s quarterly results were driven by an increase in the average effective rent per unit for the same-store portfolio. The average physical occupancy for the same-store portfolio also increased year over year.
Equity Residential’s EQR fourth-quarter 2021 normalized FFO per share of 82 cents outpaced the Zacks Consensus Estimate of 80 cents. Rental income of $645.1 million also beat the consensus mark of $628.6 million.
On a year-over-year basis, Equity Residential’s normalized FFO per share improved 7.9%, while rental income rose 5.2%. EQR’s results were driven by a strong physical occupancy, a substantially improved pricing power and higher non-Residential revenues.
Note: Anything related to earnings presented in this write-up represent funds from operations (FFO) — a widely used metric to gauge the performance of REITs.
Want the latest recommendations from Zacks Investment Research? Today, you can download 7 Best Stocks for the Next 30 Days. Click to get this free report
Equity Residential (EQR) : Free Stock Analysis Report
MidAmerica Apartment Communities, Inc. (MAA) : Free Stock Analysis Report
Regency Centers Corporation (REG) : Free Stock Analysis Report
Alexandria Real Estate Equities, Inc. (ARE) : Free Stock Analysis Report
To read this article on Zacks.com click here.
Zacks Investment Research
