
 Yahoo Finance
 Red Rock Resorts (NASDAQ:RRR) Is Experiencing Growth In Returns On Capital
If you're not sure where to start when looking for the next multi-bagger, there are a few key trends you should keep an eye out for. One common approach is to try and find a company with returns on capital employed (ROCE) that are increasing, in conjunction with a growing amount of capital employed. Basically this means that a company has profitable initiatives that it can continue to reinvest in, which is a trait of a compounding machine. So on that note, Red Rock Resorts (NASDAQ:RRR) looks quite promising in regards to its trends of return on capital.
What Is Return On Capital Employed (ROCE)?
For those who don't know, ROCE is a measure of a company's yearly pre-tax profit (its return), relative to the capital employed in the business. The formula for this calculation on Red Rock Resorts is:
Return on Capital Employed = Earnings Before Interest and Tax (EBIT) ÷ (Total Assets - Current Liabilities)
0.16 = US$591m ÷ (US$4.0b - US$349m) (Based on the trailing twelve months to December 2023).
Thus, Red Rock Resorts has an ROCE of 16%. On its own, that's a standard return, however it's much better than the 9.5% generated by the Hospitality industry.
Check out our latest analysis for Red Rock Resorts
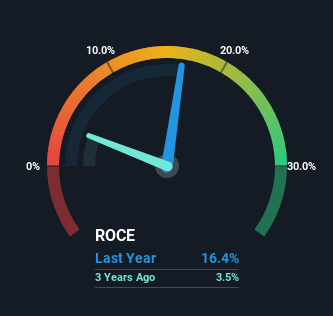
In the above chart we have measured Red Rock Resorts' prior ROCE against its prior performance, but the future is arguably more important. If you're interested, you can view the analysts predictions in our free analyst report for Red Rock Resorts .
What The Trend Of ROCE Can Tell Us
Red Rock Resorts has not disappointed with their ROCE growth. Looking at the data, we can see that even though capital employed in the business has remained relatively flat, the ROCE generated has risen by 91% over the last five years. So our take on this is that the business has increased efficiencies to generate these higher returns, all the while not needing to make any additional investments. On that front, things are looking good so it's worth exploring what management has said about growth plans going forward.
In Conclusion...
To sum it up, Red Rock Resorts is collecting higher returns from the same amount of capital, and that's impressive. Since the stock has returned a staggering 147% to shareholders over the last five years, it looks like investors are recognizing these changes. So given the stock has proven it has promising trends, it's worth researching the company further to see if these trends are likely to persist.
One final note, you should learn about the 3 warning signs we've spotted with Red Rock Resorts (including 1 which is a bit unpleasant) .
While Red Rock Resorts may not currently earn the highest returns, we've compiled a list of companies that currently earn more than 25% return on equity. Check out this free list here.
Have feedback on this article? Concerned about the content? Get in touch with us directly. Alternatively, email editorial-team (at) simplywallst.com.
This article by Simply Wall St is general in nature. We provide commentary based on historical data and analyst forecasts only using an unbiased methodology and our articles are not intended to be financial advice. It does not constitute a recommendation to buy or sell any stock, and does not take account of your objectives, or your financial situation. We aim to bring you long-term focused analysis driven by fundamental data. Note that our analysis may not factor in the latest price-sensitive company announcements or qualitative material. Simply Wall St has no position in any stocks mentioned.
