
 Yahoo Finance
 There Are Reasons To Feel Uneasy About MindChamps PreSchool's (SGX:CNE) Returns On Capital
There are a few key trends to look for if we want to identify the next multi-bagger. Firstly, we'd want to identify a growing return on capital employed (ROCE) and then alongside that, an ever-increasing base of capital employed. This shows us that it's a compounding machine, able to continually reinvest its earnings back into the business and generate higher returns. However, after investigating MindChamps PreSchool (SGX:CNE), we don't think it's current trends fit the mold of a multi-bagger.
What Is Return On Capital Employed (ROCE)?
Just to clarify if you're unsure, ROCE is a metric for evaluating how much pre-tax income (in percentage terms) a company earns on the capital invested in its business. Analysts use this formula to calculate it for MindChamps PreSchool:
Return on Capital Employed = Earnings Before Interest and Tax (EBIT) ÷ (Total Assets - Current Liabilities)
0.0056 = S$553k ÷ (S$143m - S$43m) (Based on the trailing twelve months to June 2023).
Therefore, MindChamps PreSchool has an ROCE of 0.6%. Ultimately, that's a low return and it under-performs the Consumer Services industry average of 9.3%.
View our latest analysis for MindChamps PreSchool
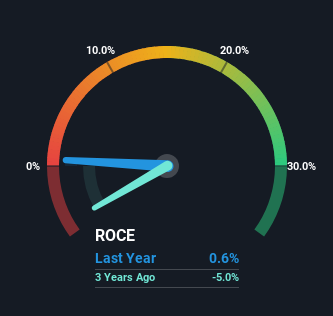
Historical performance is a great place to start when researching a stock so above you can see the gauge for MindChamps PreSchool's ROCE against it's prior returns. If you want to delve into the historical earnings , check out these free graphs detailing revenue and cash flow performance of MindChamps PreSchool.
The Trend Of ROCE
When we looked at the ROCE trend at MindChamps PreSchool, we didn't gain much confidence. Over the last five years, returns on capital have decreased to 0.6% from 10% five years ago. However it looks like MindChamps PreSchool might be reinvesting for long term growth because while capital employed has increased, the company's sales haven't changed much in the last 12 months. It's worth keeping an eye on the company's earnings from here on to see if these investments do end up contributing to the bottom line.
On a side note, MindChamps PreSchool's current liabilities have increased over the last five years to 30% of total assets, effectively distorting the ROCE to some degree. Without this increase, it's likely that ROCE would be even lower than 0.6%. Keep an eye on this ratio, because the business could encounter some new risks if this metric gets too high.
The Bottom Line
To conclude, we've found that MindChamps PreSchool is reinvesting in the business, but returns have been falling. And investors appear hesitant that the trends will pick up because the stock has fallen 57% in the last five years. On the whole, we aren't too inspired by the underlying trends and we think there may be better chances of finding a multi-bagger elsewhere.
One more thing: We've identified 3 warning signs with MindChamps PreSchool (at least 1 which is potentially serious) , and understanding these would certainly be useful.
While MindChamps PreSchool isn't earning the highest return, check out this free list of companies that are earning high returns on equity with solid balance sheets.
Have feedback on this article? Concerned about the content? Get in touch with us directly. Alternatively, email editorial-team (at) simplywallst.com.
This article by Simply Wall St is general in nature. We provide commentary based on historical data and analyst forecasts only using an unbiased methodology and our articles are not intended to be financial advice. It does not constitute a recommendation to buy or sell any stock, and does not take account of your objectives, or your financial situation. We aim to bring you long-term focused analysis driven by fundamental data. Note that our analysis may not factor in the latest price-sensitive company announcements or qualitative material. Simply Wall St has no position in any stocks mentioned.
