
 Yahoo Finance
 QAF Limited's (SGX:Q01) Financial Prospects Don't Look Very Positive: Could It Mean A Stock Price Drop In The Future?
QAF's (SGX:Q01) stock is up by 4.3% over the past three months. Given that the markets usually pay for the long-term financial health of a company, we wonder if the current momentum in the share price will keep up, given that the company's financials don't look very promising. In this article, we decided to focus on QAF's ROE.
Return on equity or ROE is an important factor to be considered by a shareholder because it tells them how effectively their capital is being reinvested. Simply put, it is used to assess the profitability of a company in relation to its equity capital.
See our latest analysis for QAF
How Do You Calculate Return On Equity?
The formula for ROE is:
Return on Equity = Net Profit (from continuing operations) ÷ Shareholders' Equity
So, based on the above formula, the ROE for QAF is:
5.6% = S$28m ÷ S$488m (Based on the trailing twelve months to December 2023).
The 'return' is the profit over the last twelve months. One way to conceptualize this is that for each SGD1 of shareholders' capital it has, the company made SGD0.06 in profit.
What Is The Relationship Between ROE And Earnings Growth?
We have already established that ROE serves as an efficient profit-generating gauge for a company's future earnings. We now need to evaluate how much profit the company reinvests or "retains" for future growth which then gives us an idea about the growth potential of the company. Generally speaking, other things being equal, firms with a high return on equity and profit retention, have a higher growth rate than firms that don’t share these attributes.
QAF's Earnings Growth And 5.6% ROE
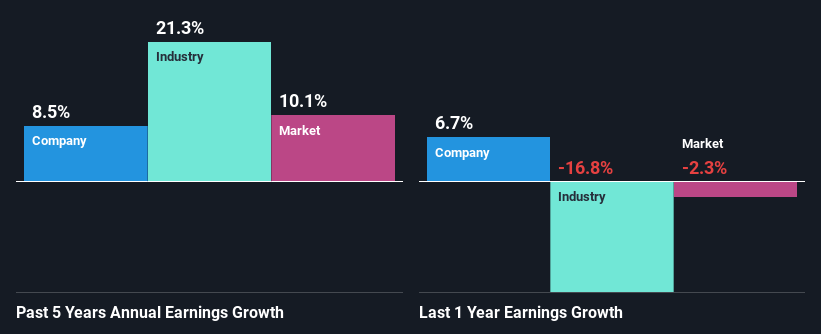
On the face of it, QAF's ROE is not much to talk about. However, its ROE is similar to the industry average of 5.4%, so we won't completely dismiss the company. On the other hand, QAF reported a moderate 8.5% net income growth over the past five years. Given the slightly low ROE, it is likely that there could be some other aspects that are driving this growth. For instance, the company has a low payout ratio or is being managed efficiently.
We then compared QAF's net income growth with the industry and found that the company's growth figure is lower than the average industry growth rate of 21% in the same 5-year period, which is a bit concerning.
Earnings growth is a huge factor in stock valuation. What investors need to determine next is if the expected earnings growth, or the lack of it, is already built into the share price. Doing so will help them establish if the stock's future looks promising or ominous. If you're wondering about QAF's's valuation, check out this gauge of its price-to-earnings ratio, as compared to its industry.
Is QAF Making Efficient Use Of Its Profits?
QAF's high three-year median payout ratio of 112% suggests that the company is paying out more to its shareholders than what it is making. Still the company's earnings have grown respectably. Although, the high payout ratio is certainly something we would keep an eye on if the company is not able to keep up its growth, or if business deteriorates. You can see the 2 risks we have identified for QAF by visiting our risks dashboard for free on our platform here.
Besides, QAF has been paying dividends for at least ten years or more. This shows that the company is committed to sharing profits with its shareholders.
Summary
In total, we would have a hard think before deciding on any investment action concerning QAF. While the company has posted decent earnings growth, the company is retaining little to no profits and is reinvesting those profits at a low rate of return. This makes us doubtful if that growth could continue, especially if by any chance the business is faced with any sort of risk. Until now, we have only just grazed the surface of the company's past performance by looking at the company's fundamentals. So it may be worth checking this free detailed graph of QAF's past earnings, as well as revenue and cash flows to get a deeper insight into the company's performance.
Have feedback on this article? Concerned about the content? Get in touch with us directly. Alternatively, email editorial-team (at) simplywallst.com.
This article by Simply Wall St is general in nature. We provide commentary based on historical data and analyst forecasts only using an unbiased methodology and our articles are not intended to be financial advice. It does not constitute a recommendation to buy or sell any stock, and does not take account of your objectives, or your financial situation. We aim to bring you long-term focused analysis driven by fundamental data. Note that our analysis may not factor in the latest price-sensitive company announcements or qualitative material. Simply Wall St has no position in any stocks mentioned.
