
 Yahoo Finance
 Is Public Joint-Stock Company Mobile TeleSystems’s (NYSE:MBT) Balance Sheet A Threat To Its Future?

Small-cap and large-cap companies receive a lot of attention from investors, but mid-cap stocks like Public Joint-Stock Company Mobile TeleSystems (NYSE:MBT), with a market cap of US$8.29b, are often out of the spotlight. While they are less talked about as an investment category, mid-cap risk-adjusted returns have generally been better than more commonly focused stocks that fall into the small- or large-cap categories. Today we will look at MBT’s financial liquidity and debt levels, which are strong indicators for whether the company can weather economic downturns or fund strategic acquisitions for future growth. Note that this commentary is very high-level and solely focused on financial health, so I suggest you dig deeper yourself into MBT here. Check out our latest analysis for Mobile TeleSystems
Does MBT produce enough cash relative to debt?
MBT’s debt levels surged from US$284.85b to US$303.57b over the last 12 months – this includes both the current and long-term debt. With this growth in debt, the current cash and short-term investment levels stands at US$81.34b , ready to deploy into the business. On top of this, MBT has produced cash from operations of US$144.64b during the same period of time, leading to an operating cash to total debt ratio of 47.65%, signalling that MBT’s operating cash is sufficient to cover its debt. This ratio can also be a sign of operational efficiency as an alternative to return on assets. In MBT’s case, it is able to generate 0.48x cash from its debt capital.
Does MBT’s liquid assets cover its short-term commitments?
With current liabilities at US$156.67b, it appears that the company has not maintained a sufficient level of current assets to meet its obligations, with the current ratio last standing at 0.93x, which is below the prudent industry ratio of 3x.
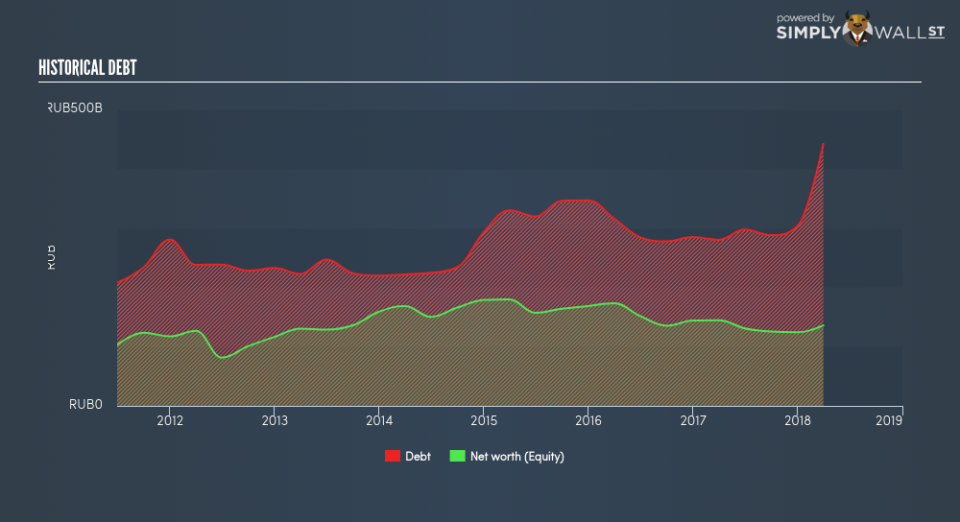
Is MBT’s debt level acceptable?
MBT is a highly-leveraged company with debt exceeding equity by over 100%. This is not uncommon for a mid-cap company given that debt tends to be lower-cost and at times, more accessible. We can check to see whether MBT is able to meet its debt obligations by looking at the net interest coverage ratio. A company generating earnings before interest and tax (EBIT) at least three times its net interest payments is considered financially sound. In MBT’s, case, the ratio of 4.73x suggests that interest is appropriately covered, which means that debtors may be willing to loan the company more money, giving MBT ample headroom to grow its debt facilities.
Next Steps:
Although MBT’s debt level is towards the higher end of the spectrum, its cash flow coverage seems adequate to meet debt obligations which means its debt is being efficiently utilised. But, its low liquidity raises concerns over whether current asset management practices are properly implemented for the mid-cap. Keep in mind I haven’t considered other factors such as how MBT has been performing in the past. I recommend you continue to research Mobile TeleSystems to get a better picture of the stock by looking at:
Future Outlook: What are well-informed industry analysts predicting for MBT’s future growth? Take a look at our free research report of analyst consensus for MBT’s outlook.
Valuation: What is MBT worth today? Is the stock undervalued, even when its growth outlook is factored into its intrinsic value? The intrinsic value infographic in our free research report helps visualize whether MBT is currently mispriced by the market.
Other High-Performing Stocks: Are there other stocks that provide better prospects with proven track records? Explore our free list of these great stocks here.
To help readers see pass the short term volatility of the financial market, we aim to bring you a long-term focused research analysis purely driven by fundamental data. Note that our analysis does not factor in the latest price sensitive company announcements.
The author is an independent contributor and at the time of publication had no position in the stocks mentioned.
