
 Yahoo Finance
 Profire Energy Reports Financial Results for Fourth Quarter and Full Fiscal Year 2023

Company Reports Record Full-Year Revenue, Net Income and EBITDA
LINDON, Utah, March 13, 2024 (GLOBE NEWSWIRE) — Profire Energy, Inc. (NASDAQ: PFIE), a technology company (the "Company") that provides solutions which enhance the efficiency, safety, and reliability of industrial combustion appliances, today reported financial results for its fourth quarter and full fiscal year ending December 31, 2023. A conference call will be held on Thursday, March 14, 2024, at 8:30 a.m. ET to discuss the results.
Full-year Fiscal 2023 Summary
Revenue of $58.2 million, a 27% increase from prior year
Gross profit of $30.5 million or 52.5% of total revenues
Net income of $10.8 million or $0.22 per diluted share
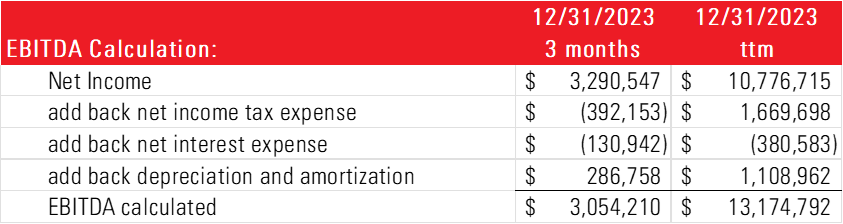
Generated EBITDA of $13.2 million
Repurchased 1.2 million shares of stock for $2 million
Cash and liquid investments of $20 million and remained debt-free
Fourth Quarter Summary
Revenue of $14.4 million, compared to $14 million in the prior year quarter
Gross profit of $7.8 million, a 19% increase compared to 4Q22
Gross margin of 54.3%, a 730 basis point increase from prior year
Net income of $3.3 million, or $0.07 per diluted share
Generated EBITDA of $3.1 million
“2023 was a record year for Profire, recording our highest annual revenue, net income, and EBITDA in company history,” said Ryan Oviatt, Co-Chief Executive Officer and CFO of Profire Energy. “We expanded our full-year gross margin and used a portion of our operating cash flow to repurchase 1.2 million of our outstanding shares. Our solid balance sheet provides great flexibility for us to simultaneously invest in our business, repurchase shares when the market presents the opportunity and pursue other investment opportunities that will enhance our future, with the ongoing focus of delivering long-term value for our shareholders.”
Full Year 2023 Financial Results
Total revenues for the year equaled $58.2 million, versus $45.9 million in the prior year. The increase was primarily driven by improved customer demand and progress in the Company's revenue diversification efforts.
Gross profit was $30.5 million compared to $21.7 million last year. Gross margin was 52.5% of total revenues, compared to 47.1% of revenues in the prior year. The increase was driven by better fixed cost leverage as a result of the higher revenue base.
Total operating expenses were $18.7 million, or 32% of revenue versus $16.5 million, or 36% of revenue in the prior year. The increase is primarily due to inflationary pressures on employee costs and increased business activity that drives variable costs, however the decrease as a percent of revenue reflects the Company’s ability to manage its cost structure while still increasing business activity.
Compared with last year, operating expenses for G&A increased 16%, R&D decreased 13% and depreciation decreased 8%.
Net income was $10.8 million or $0.22 per diluted share, compared to $3.9 million or $0.08 per diluted share last year. This year’s results include a one-time $828,000, or two cent per diluted share benefit generated from a reduction adjustment to deferred tax expense based on a detailed review of our deferred tax balances.
Over the past two years, Profire implemented several tax planning strategies that have had a significant benefit on the Company’ s financial performance and results of operations. These include filing for and receiving the employee retention credit through the CARES act, the strategic use of several years of net operating losses in Profire’s Canadian subsidiary and the deferred tax true-up noted above. The impact of these tax planning strategies in 2023 caused operating expenses to be lower by $760,000, reduced income tax expenses, and an increase to net income of $1.9 million or four cents per diluted share. However, even when removing these non-recuring adjustments, 2023 remains the Company’s best year from an operating income, net income, and earnings per share perspective.
Cash and liquid investments totaled $20.0 million on December 31, 2023 compared to $16.0 million at the end of 2022, and the Company continues to operate debt-free.
Fourth Quarter 2023 Financial Results
Total revenues for the period equaled $14.4 million, compared to $14.8 million in the third quarter of 2023 and $14.0 million in the prior-year quarter.
Gross profit was $7.8 million, compared to $7.5 million in the third quarter of 2023 and $6.6 million in the prior-year quarter. Gross margin was 54% of revenues, compared to 50.4% of revenues in the prior quarter and 47.0% of revenues in the fourth quarter of 2022. The sequential and year-over-year increase in gross profit and gross margin is due to pricing incentives and better fixed cost coverage.
Total operating expenses were $5.0 million, compared to $4.9 million in the third quarter of 2023 and $4.3 million in the year-ago quarter. The year-over-year increase is related to the inflationary pressures on our business as well as increased business activity that impacts variable costs.
Compared with the same quarter last year, operating expenses for G&A increased by 18%, R&D increased 15% and depreciation decreased by 1%.
Net income was $3.3 million, or $0.07 per diluted share, compared to net income of $2.0 million or $0.04 per diluted share in the third quarter of 2023 and $1.8 million or $0.04 per diluted share in the same quarter last year. This quarter’s results include the $828,000 or $0.02 per diluted share benefit related to the deferred tax adjustment noted earlier.
“Our record performance in 2023 was driven through a combination of continued demand for our legacy products and increased traction across our diversification strategy, which now represents more than 13% percent of our total revenue, compared to less than one percent in 2021,” stated Cameron Tidball, Co-CEO of Profire Energy. “Demand for hydrocarbons remains strong globally and we continue to benefit from operators playing catch-up on capital expenditures that had been deferred since the pandemic. We also expect to attract new users for our applications beyond the oil and gas markets during the year. Overall, we remain confident about our prospects for 2024 and beyond.”
Conference Call
Profire Energy Executives will host the call, followed by a question-and-answer period.
Date: Thursday, March 14, 2024
Time: 8:30 a.m. ET (6:30 a.m. MT)
Toll-free dial-in number: 1-855-327-6837
International dial-in number: 1-631-891-4304
The conference call will be webcast live and available for replay via this link:
https://viavid.webcasts.com/starthere.jsp?ei=1653741&tp_key=d0612fee82
The webcast replay will be available for one year.
Please call the conference telephone number five minutes prior to the start time. An operator will register your name and organization. If you have any difficulty connecting the conference call, please contact Athena Kefalas at 1-801-701-8969.
A replay of the call will be available via the dial-in numbers below after 12:30 p.m. ET on the same day through March 28, 2024.
Toll-free replay number: 1-844-512-2921
International replay number: 1-412-317-6671
Replay Pin Number: 10022990
About Profire Energy, Inc.
Profire Energy is a technology company providing solutions that enhance the efficiency, safety, and reliability of industrial combustion appliances while mitigating potential environmental impacts related to the operation of these devices. It is primarily focused in the upstream, midstream, and downstream transmission segments of the oil and gas industry. However, in recent years, we have completed many installations of our burner-management solutions in other industries that we believe will be applicable as we expand our addressable market over time. Profire specializes in the engineering and design of burner and combustion management systems and solutions used on a variety of natural and forced draft applications. Its products and services are sold primarily throughout North America. It has an experienced team of sales and service professionals that are strategically positioned across the United States and Canada. Profire has offices in Lindon, Utah; Victoria, Texas; Homer, Pennsylvania; Greeley, Colorado; Millersburg, Ohio; and Acheson, Alberta, Canada. For additional information, visit www.profireenergy.com.
Cautionary Note Regarding Forward-Looking Statements. Statements made in this release that are not historical are forward-looking statements. This release contains forward-looking statements, including, but not limited to statements regarding the Company’s expected growth, attracting new users beyond the oil and gas market, the Company’s plans to make internal and external investments, and delivering long-term value to the Company’s shareholders. Forward-looking statements are not guarantees of future results or performance and involve risks, assumptions and uncertainties that could cause actual events or results to differ materially from the events or results described in, or anticipated by, the forward-looking statements. Factors that could materially affect such forward-looking statements include certain economic, business, public market and regulatory risks and factors identified in the company's periodic reports filed with the Securities and Exchange Commission. All forward-looking statements are made pursuant to the safe harbor provisions of the Private Securities Litigation Reform Act of 1995. All forward-looking statements are made only as of the date of this release and the Company assumes no obligation to update forward-looking statements to reflect subsequent events or circumstances, except as required by law. Readers should not place undue reliance on these forward-looking statements.
Contact:
Profire Energy, Inc.
Ryan Oviatt, Co-CEO & CFO
(801) 796-5127
Three Part Advisors
Steven Hooser, Partner
214-872-2710
About Non-GAAP Financial Measures
To supplement our consolidated financial statements, which statements are prepared and presented in accordance with GAAP, we use the following non-GAAP financial measure of earnings before interest, taxes, depreciation and amortization (“EBITDA”). The presentation of this financial information is not intended to be considered in isolation or as a substitute for, or superior to, the financial information prepared and presented in accordance with GAAP.
We use this non-GAAP financial measure for financial and operational decision making and as a means to evaluate period-to-period comparisons. Our management believes that this non-GAAP financial measure provides meaningful supplemental information regarding our performance. We believe that both management and investors benefit from referring to this non-GAAP financial measure in assessing our performance and when planning, forecasting, and analyzing future periods. We believe this non-GAAP financial measure is useful to investors both because it allows for greater transparency with respect to key metrics used by management in its financial and operational decision making.
The Following is a tabular presentation of EBITDA, including a reconciliation to net income which the Company believes to be the most directly comparable US GAAP financial measure.
PROFIRE ENERGY, INC. AND SUBSIDIARIES | |||||||
Consolidated Statements of Operations and Comprehensive Income | |||||||
For the Year Ended December 31, 2023 | For the Year Ended December 31, 2022 | ||||||
(See note 1) | |||||||
REVENUES (note 10) | |||||||
Sales of goods, net | $ | 54,284,295 | $ | 42,318,263 | |||
Sales of services, net | 3,923,765 | 3,618,380 | |||||
Total Revenues | 58,208,060 | 45,936,643 | |||||
COST OF SALES | |||||||
Cost of goods sold-product | 24,528,345 | 21,425,176 | |||||
Cost of goods sold-services | 3,147,697 | 2,860,077 | |||||
Total Cost of Goods Sold | 27,676,042 | 24,285,253 | |||||
GROSS PROFIT | 30,532,018 | 21,651,390 | |||||
OPERATING EXPENSES | |||||||
General and administrative | 17,184,917 | 14,776,905 | |||||
Research and development | 917,123 | 1,051,858 | |||||
Depreciation and amortization | 575,878 | 628,019 | |||||
Total Operating Expenses | 18,677,918 | 16,456,782 | |||||
INCOME FROM OPERATIONS | 11,854,100 | 5,194,608 | |||||
OTHER INCOME (EXPENSE) | |||||||
Gain on sale of property and equipment | 268,817 | 318,075 | |||||
Other income (expense) | (57,088 | ) | 14,383 | ||||
Interest income | 390,031 | 177,125 | |||||
Interest expense | (9,449 | ) | (18,009 | ) | |||
Total Other Income | 592,311 | 491,574 | |||||
INCOME BEFORE INCOME TAXES | 12,446,411 | 5,686,182 | |||||
INCOME TAX EXPENSE (note 12) | (1,669,697 | ) | (1,738,422 | ) | |||
NET INCOME | $ | 10,776,714 | $ | 3,947,760 | |||
OTHER COMPREHENSIVE INCOME (LOSS) | |||||||
Foreign currency translation gain (loss) | $ | 275,810 | $ | (670,167 | ) | ||
Unrealized gains (losses) on investments | 174,361 | (524,239 | ) | ||||
Total Other Comprehensive Income (Loss) | 450,171 | (1,194,406 | ) | ||||
COMPREHENSIVE INCOME | $ | 11,226,885 | $ | 2,753,354 | |||
BASIC EARNINGS PER SHARE (note 13) | $ | 0.23 | $ | 0.08 | |||
FULLY DILUTED EARNINGS PER SHARE (note 13) | $ | 0.22 | $ | 0.08 | |||
BASIC WEIGHTED AVG NUMBER OF SHARES OUTSTANDING | 47,355,978 | 47,161,101 | |||||
FULLY DILUTED WEIGHTED AVG NUMBER OF SHARES OUTSTANDING | 49,127,558 | 48,447,342 | |||||
These financial statements should be read in conjunction with the Form 10-K and accompanying footnotes. | |||||||
PROFIRE ENERGY, INC. AND SUBSIDIARIES | |||||||
Consolidated Balance Sheets | |||||||
As of | |||||||
ASSETS | December 31, 2023 | December 31, 2022 | |||||
CURRENT ASSETS | |||||||
Cash and cash equivalents | $ | 10,767,519 | $ | 7,384,578 | |||
Short-term investments (note 2) | 2,799,539 | 1,154,284 | |||||
Accounts receivable, net | 14,013,740 | 10,886,145 | |||||
Inventories, net (note 3) | 14,059,656 | 10,293,980 | |||||
Prepaid expenses and other current assets (note 4) | 2,832,262 | 2,314,639 | |||||
Total Current Assets | 44,472,716 | 32,033,626 | |||||
LONG-TERM ASSETS | |||||||
Net deferred tax asset | 496,785 | — | |||||
Long-term investments (note 2) | 6,425,582 | 7,503,419 | |||||
Lease right-of-use asset (note 8) | 432,907 | 120,239 | |||||
Property and equipment, net (note 5) | 10,782,372 | 10,423,964 | |||||
Intangible assets, net (note 6) | 1,104,102 | 1,268,907 | |||||
Goodwill (note 6) | 2,579,381 | 2,579,381 | |||||
Total Long-Term Assets | 21,821,129 | 21,895,910 | |||||
TOTAL ASSETS | $ | 66,293,845 | $ | 53,929,536 | |||
LIABILITIES AND STOCKHOLDERS' EQUITY | |||||||
CURRENT LIABILITIES | |||||||
Accounts payable | $ | 2,699,556 | $ | 2,955,506 | |||
Accrued liabilities (note 7) | 4,541,820 | 3,573,994 | |||||
Current lease liability (note 8) | 130,184 | 53,646 | |||||
Income taxes payable | 1,723,910 | 205,169 | |||||
Total Current Liabilities | 9,095,470 | 6,788,315 | |||||
LONG-TERM LIABILITIES | |||||||
Net deferred income tax liability | 52,621 | 488,858 | |||||
Long-term lease liability (note 8) | 307,528 | 67,883 | |||||
TOTAL LIABILITIES | 9,455,619 | 7,345,056 | |||||
STOCKHOLDERS' EQUITY (note 9) | |||||||
Preferred stock: $0.001 par value, 10,000,000 shares authorized: no shares issued or outstanding | — | — | |||||
Common stock: $0.001 par value, 100,000,000 shares authorized: 53,047,231 issued and 46,803,868 outstanding at December 31, 2023, and 52,143,901 issued and 47,105,771 outstanding at December 31, 2022 | 53,048 | 52,144 | |||||
Treasury stock, at cost | (9,324,272 | ) | (7,336,323 | ) | |||
Additional paid-in capital | 32,751,749 | 31,737,843 | |||||
Accumulated other comprehensive loss | (2,844,702 | ) | (3,294,873 | ) | |||
Retained earnings | 36,202,403 | 25,425,689 | |||||
TOTAL STOCKHOLDERS' EQUITY | 56,838,226 | 46,584,480 | |||||
TOTAL LIABILITIES AND STOCKHOLDERS' EQUITY | $ | 66,293,845 | $ | 53,929,536 | |||
These financial statements should be read in conjunction with the Form 10-K and accompanying footnotes. | |||||||
PROFIRE ENERGY, INC. AND SUBSIDIARIES | |||||||
Consolidated Statements of Cash Flows | |||||||
For the Year Ended December 31, 2023 | For the Year Ended December 31, 2022 | ||||||
OPERATING ACTIVITIES | |||||||
Net income | $ | 10,776,714 | $ | 3,947,760 | |||
Adjustments to reconcile net income to net cash provided by operating activities: | |||||||
Depreciation and amortization expense | 1,108,962 | 1,101,044 | |||||
Gain on sale of property and equipment | (268,817 | ) | (318,075 | ) | |||
Bad debt expense | 488,420 | 77,704 | |||||
Stock awards issued for services | 1,043,740 | 814,769 | |||||
Changes in operating assets and liabilities: | |||||||
Accounts receivable | (3,128,051 | ) | (4,745,871 | ) | |||
Income taxes receivable/payable | 1,515,843 | 765,650 | |||||
Inventories | (3,712,212 | ) | (3,240,049 | ) | |||
Prepaid expenses and other current assets | (480,308 | ) | (1,337,076 | ) | |||
Deferred tax asset/liability | (933,969 | ) | 512,274 | ||||
Accounts payable and accrued liabilities | 653,728 | 2,937,947 | |||||
Net Cash Provided by Operating Activities | 7,064,050 | 516,077 | |||||
INVESTING ACTIVITIES | |||||||
Proceeds from sale of property and equipment | 354,840 | 520,068 | |||||
Sale (purchase) of investments | (393,057 | ) | 91,601 | ||||
Purchase of property and equipment | (1,228,275 | ) | (601,012 | ) | |||
Net Cash Provided by (Used in) Investing Activities | (1,266,492 | ) | 10,657 | ||||
FINANCING ACTIVITIES | |||||||
Value of equity awards surrendered by employees for tax liability | (605,996 | ) | (145,930 | ) | |||
Cash received in exercise of stock options | 177,281 | 33,863 | |||||
Purchase of treasury stock | (1,987,949 | ) | (1,228,730 | ) | |||
Principal paid towards lease liability | (37,855 | ) | (34,214 | ) | |||
Net Cash Used in Financing Activities | (2,454,519 | ) | (1,375,011 | ) | |||
Effect of exchange rate changes on cash | 39,902 | 44,585 | |||||
NET INCREASE (DECREASE) IN CASH | 3,382,941 | (803,692 | ) | ||||
CASH AT BEGINNING OF PERIOD | 7,384,578 | 8,188,270 | |||||
CASH AT END OF PERIOD | $ | 10,767,519 | $ | 7,384,578 | |||
SUPPLEMENTAL DISCLOSURES OF CASH FLOW INFORMATION | |||||||
CASH PAID FOR: | |||||||
Interest | $ | 9,450 | $ | 17,726 | |||
Income taxes | $ | 1,155,682 | $ | 847,712 | |||
NON-CASH FINANCING AND INVESTING ACTIVITIES: | |||||||
Common stock issued in settlement of accrued bonuses | $ | 378,526 | $ | 212,788 | |||
These financial statements should be read in conjunction with the Form 10-K and accompanying footnotes. | |||||||
An image accompanying this announcement is available at https://www.globenewswire.com/NewsRoom/AttachmentNg/ef385693-c44b-4e42-81f6-06f60c4f80d2

