
 Yahoo Finance
 Procter & Gamble (PG) Q3 Earnings Top Estimates, Sales Miss
The Procter & Gamble Company PG has reported third-quarter fiscal 2024 results, wherein earnings surpassed the Zacks Consensus Estimate, while sales missed the same. Sales and earnings improved year over year. The company’s organic sales grew, driven by robust pricing, along with strength across segments.
Procter & Gamble’s core earnings of $1.52 per share increased 11% from $1.37 in the year-ago quarter. The figure also beat the Zacks Consensus Estimate of $1.42. The strong bottom-line results have stemmed from sales growth, an improved operating margin and lower shares outstanding. Currency-neutral net earnings per share (EPS) rose 18% year over year.
The company has reported net sales of $20,195 million, up 1% year over year. Sales missed the Zacks Consensus Estimate of $20,483 million. The increase in sales can be attributed to growth across all segments, except for Baby, Feminine & Family Care. Currency negatively impacted net sales by 2%.
Procter & Gamble Company (The) Price, Consensus and EPS Surprise
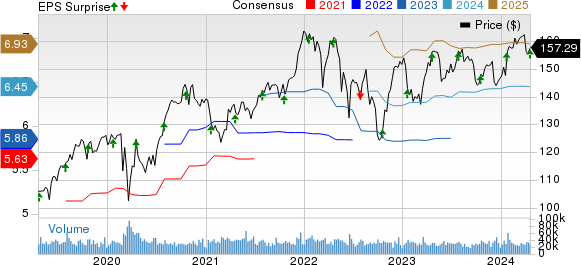
Procter & Gamble Company (The) price-consensus-eps-surprise-chart | Procter & Gamble Company (The) Quote
On an organic basis (excluding the impacts of acquisitions, divestitures and foreign exchange), revenues improved 3% year over year, backed by a 3% rise in pricing, and flat product mix and volume.
Our model predicted year-over-year organic revenue growth of 4.4% for the fiscal third quarter, with a 2.8% gain from pricing, 1.3% growth from the product mix and a 0.2% rise in volume.
Net sales increased 2% year over year each for the Beauty, Health Care, and Fabric & Home Care segments, and 3% for Grooming. However, net sales declined 2% for the Baby, Feminine & Family Care segment. All the company’s business segments have reported growth in organic sales, while organic sales for the Baby, Feminine & Family Care segment were flat year over year. Organic sales rose 3% for Beauty, 10% for Grooming, 3% for Fabric & Home Care, and 2% for the Health Care segment.
Shares of the company declined 1.5% in the pre-market session, following the soft top-line results. The Zacks Rank #4 (Sell) company’s stock has gained 4.2% in the past year compared with the industry’s 1.1% growth.
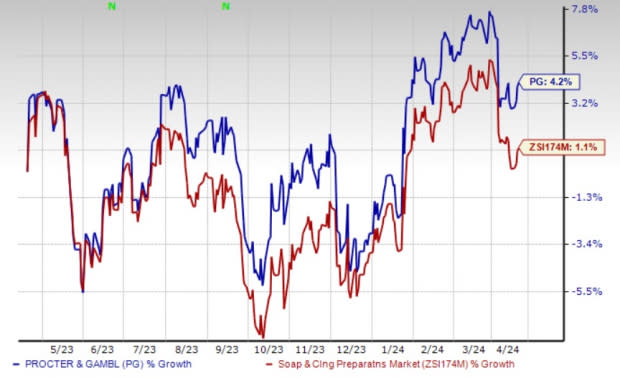
Image Source: Zacks Investment Research
Margins
In the reported quarter, the core gross margin increased 310 basis points (bps) year over year to 51.3%. Favorable currency rates aided the gross margin by 0.9%. The currency-neutral gross margin improved 400 bps to 52.2%. The increase in the gross margin was driven by 130 bps each of pricing gains and favorable commodity costs, as well as a 260-bps benefit of gross productivity savings. This was partly offset by a 100-bps impact of a negative gross margin product mix, and 20 bps of product reinvestments and other impacts.
Selling, general and administrative expenses (SG&A), as a percentage of sales, expanded 210 bps from the year-ago quarter to 29.1%. Currency hurt the SG&A expense rate by 0.4%. The SG&A expense rate increased 170 bps to 28.7% on a currency-neutral basis. The increase was driven by a 330-bps rise in reinvestments, offset by 60-bps of productivity savings, and 100-bps net sales growth leverage and other impacts.
The operating margin rose 90 bps from the prior year to 22.1%. Currency rates aided the operating margin by 1.3%. On a currency-neutral basis, the operating margin expanded 220 bps to 23.4%. The operating margin included gross productivity savings of 320 bps.
We had expected the core gross profit margin to expand 80 bps year over year in the fiscal third quarter. The core SG&A expense rate was anticipated to increase 90 bps, while our core operating margin projection suggested a decline of 10 bps.
Financials
Procter & Gamble ended third-quarter fiscal 2024 with cash and cash equivalents of $6,828 million, long-term debt of $24,253 million, and total shareholders’ equity of $50,333 million.
The company generated an operating cash flow of $14,092 million for the nine months ended Mar 31, 2024, and an adjusted free cash flow of $3,291 million. Adjusted free cash flow productivity was 87% in the fiscal third quarter.
Procter & Gamble returned $3.3 billion of value to its shareholders in third-quarter fiscal 2024. This included $2.3 billion of dividend payouts and $1 billion of share buybacks.
FY24 Guidance
Management has maintained its sales and cash return view, and raised its core and GAAP EPS view for fiscal 2024. The company anticipates year-over-year all-in sales growth of 2-4% for fiscal 2024. Organic sales are likely to increase 4-5% in fiscal 2024. Currency movements are expected to negatively impact all-in sales growth by 1-2%.
Procter & Gamble expects GAAP EPS to increase 1-2% year over year for fiscal 2024. Earlier, the company predicted GAAP EPS between a 1% decline and flat year over year. Notably, it posted $5.90 in fiscal 2023. Core EPS is expected to increase 10-11% year over year compared with growth of 8-9% mentioned earlier.
The current earnings view for fiscal 2024 includes an after-tax headwind of $900 million related to favorable commodity costs, net of adverse currency impacts. However, the company expects unfavorable currency rates to be a headwind of $800 billion after tax. Procter & Gamble expects the net impact of interest expenses and interest income to be a headwind of $100 million after tax.
The company projects a core effective tax rate of 20-21% for fiscal 2024. It expects a capital expenditure of 4% of net sales in fiscal 2024.
Adjusted free cash flow productivity is estimated to be 90% for fiscal 2024. The company intends to make dividend payments of more than $9 billion, along with share repurchases of $5-$6 billion in fiscal 2024.
Here’s How Better-Ranked Stocks Fared
We highlighted some better-ranked stocks from the broader Consumer Staples space, namely Colgate-Palmolive CL, Church & Dwight Co. CHD and Celsius CELH.
Colgate currently carries a Zacks Rank #2 (Buy). CL has a trailing four-quarter earnings surprise of 4.2%, on average. The company has gained 13.6% in the past year.
You can see the complete list of today’s Zacks #1 Rank (Strong Buy) stocks here.
The Zacks Consensus Estimate for Colgate’s current financial-year sales and EPS suggests growth of 3.6% and 8.4%, respectively, from the year-ago reported numbers. The consensus mark for CL’s EPS has been unchanged in the past 30 days.
Church & Dwight currently carries a Zacks Rank of 2. CHD has a trailing four-quarter earnings surprise of 9.7%, on average. The company has risen 14.3% in the past year.
The Zacks Consensus Estimate for CHD’s current financial year’s sales and earnings suggests growth of 4.5% and 8.5%, respectively, from the prior-year reported numbers. The consensus mark for Church & Dwight’s EPS has moved up by a penny in the past 30 days.
Celsius currently carries a Zacks Rank #2. CELH has a trailing four-quarter earnings surprise of 67.4%, on average. The company has gained 133.2% in the past year.
The Zacks Consensus Estimate for Celsius’ current financial year’s sales and EPS suggests growth of 41.62% and 41.56%, respectively, from the year-ago reported numbers. The consensus mark for CELH’s EPS has been unchanged in the past 30 days.
Want the latest recommendations from Zacks Investment Research? Today, you can download 7 Best Stocks for the Next 30 Days. Click to get this free report
Procter & Gamble Company (The) (PG) : Free Stock Analysis Report
Colgate-Palmolive Company (CL) : Free Stock Analysis Report
Church & Dwight Co., Inc. (CHD) : Free Stock Analysis Report
Celsius Holdings Inc. (CELH) : Free Stock Analysis Report
