
 Yahoo Finance
 Price & Time: NZD/USD Breaks Key Confluence - Now What?
DailyFX.com -
Price & Time covers key technical themes daily and can be delivered to your inbox each morning by joining the distribution list: Price & Time
Talking Points
NZD/USD cracks key long-term support confluence
Near term cyclical reprieve?
Unfamiliar with Fibonacci Relationships? Learn more about them HERE
NZD/USD: Breaks Key Confluence – Now What?
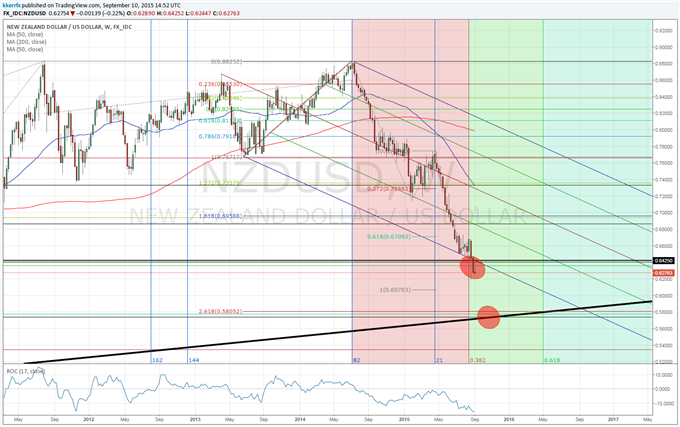
Today I am looking at a weekly chart of NZD/USD. The action of the past couple of weeks (and last few days for that matter) hasn’t been very positive. The zone between .6350 and .6425 was a potentially important area of support where a counter-trend recovery could and should have probably developed as it marked the 61.8% retracement of the 2009 – 2011 advance, the 50% retracement of the 2000 – 2011 advance and the lower parallel of a pitchfork connecting the key highs and lows of 2013 and 2014.
The fact it did not is a clear technical negative for the Bird that warns of general weakness ahead over the next few weeks and months. The general rule of thumb with Fibonacci clusters is that after a market breaks through one convincingly it should gravitate towards the next. With NZD/USD working on its second consecutive weekly close below the confluence zone, the risk is that it makes its way towards the next cluster in the upper .5000s (the zone between .5800 and .5725 marks a confluence of the 78.6% retracement of 2009 – 2011 advance, the 61.8% retracement of the 2000 – 2011 advance, the 261.8% extension of the 2013 – 2014 range and a trendline connecting the 2001 and 2009 lows).
From a timing perspective the next major window in NZD/USD looks to be around the middle of November as a variety of key relationships will be converging around this time. Should kiwi trend down into the confluence zone around this time, things could get very interesting (this piece is called Price & Time after all). November is a long time away, however, and there are plenty of minor cycles to navigate through before then. One is actually this week, as the kiwi is a Fibonacci 21 weeks from the July high, 62 weeks from the June 2014 high and 144 weeks from the December 2012 high. Perhaps we see the exchange rate try to mount a modest recovery as a result, but it would take a move through failed support turned resistance at .6425 to signal that something more meaningful is developing.
--- Written by Kristian Kerr, Senior Currency Strategist for DailyFX.com
To contact Kristian, e-mail kkerr@fxcm.com. Follow me on Twitter @KKerrFX
DailyFX provides forex news and technical analysis on the trends that influence the global currency markets.
Learn forex trading with a free practice account and trading charts from FXCM.
