
 Yahoo Finance
 Will Portfolio Strength & User Growth Aid MSCI Q2 Earnings?
MSCI Inc. MSCI is set to report second-quarter 2019 results on Aug 1.
The company’s earnings beat the Zacks Consensus Estimate over the trailing four quarters, the average positive surprise being 4%.
In the last reported quarter, MSCI reported adjusted earnings of $1.55 per share, which beat the Zacks Consensus Estimate by 14 cents and increased 18.3% year over year.
Operating revenues were up 5.7% year over year to $371.4 million in the first quarter, slightly better than the consensus mark of $370 million.
At the end of the quarter, assets under management (AUM) were $802.2 billion in ETFs linked to MSCI indexes, up 4.9% year over year. Total Retention Rate was 95.2% at the end of the quarter.
MSCI Inc Price and EPS Surprise
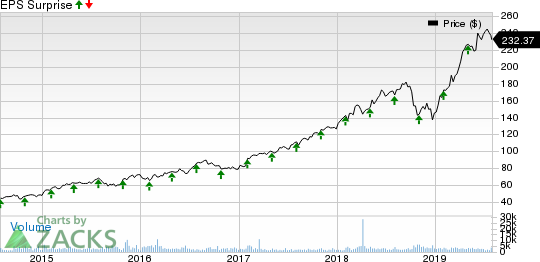
MSCI Inc price-eps-surprise | MSCI Inc Quote
Meanwhile, the Zacks Consensus Estimate for second-quarter earnings has remained steady at $1.49 over the past seven days, indicating growth of 14.6% from the year-ago quarter’s reported figure. The consensus mark for revenues currently stands at $381.5 million, suggesting year-over-year growth of 5.1%.
Let’s see how things are shaping up for this announcement.
Key Factors to Consider
MSCI is expected to benefit from strong demand for custom and factor index modules. Increasing adoption of the Environmental, Social and Governance (ESG) solution in the investment process is a key catalyst.
Notably, MSCI has completed the integration of ESG in all its risk analytics systems. This is spurring demand for the company’s multi-asset class risk and performance analytics solution.
Additionally, growing passive and index-based investing is driving demand for the company’s Index products, which have gained strong traction among client segments, like wealth management, banks and broker dealers, and hedge funds.
These factors are anticipated to boost the top line in the soon-to-be-reported quarter.
What Our Model Says
According to the Zacks model, a company with a Zacks Rank #1 (Strong Buy), 2 (Buy) or 3 (Hold), along with a positive Earnings ESP has a good chance of beating estimates. Meanwhile, Sell-rated stocks (Zacks Rank #4 or 5) are best avoided.
MSCI carries a Zacks Rank #4 but has an Earnings ESP of +0.67%. You can uncover the best stocks to buy or sell before they’re reported with our Earnings ESP Filter.
Stocks That Warrant a Look
Here are three stocks that you may want to consider as our model shows that these have the right combination of elements to deliver an earnings beat in this earnings season.
CGI Group GIB has an Earnings ESP of +1.27% and a Zacks Rank #2. You can see the complete list of today’s Zacks #1 Rank stocks here.
Zendesk ZEN has an Earnings ESP of +7.84% and a Zacks Rank #2.
CACI International CACI has an Earnings ESP of +4.02% and a Zacks Rank #2.
Today's Best Stocks from Zacks
Would you like to see the updated picks from our best market-beating strategies? From 2017 through 2018, while the S&P 500 gained +15.8%, five of our screens returned +38.0%, +61.3%, +61.6%, +68.1%, and +98.3%.
This outperformance has not just been a recent phenomenon. From 2000 – 2018, while the S&P averaged +4.8% per year, our top strategies averaged up to +56.2% per year.
See their latest picks free >>
Want the latest recommendations from Zacks Investment Research? Today, you can download 7 Best Stocks for the Next 30 Days. Click to get this free report
MSCI Inc (MSCI) : Free Stock Analysis Report
Zendesk, Inc. (ZEN) : Free Stock Analysis Report
CACI International, Inc. (CACI) : Free Stock Analysis Report
CGI Group, Inc. (GIB) : Free Stock Analysis Report
To read this article on Zacks.com click here.
Zacks Investment Research
