
 Yahoo Finance
 Is Pharmagest Interactive SA’s (EPA:PHA) Balance Sheet A Threat To Its Future?

Investors are always looking for growth in small-cap stocks like Pharmagest Interactive SA (EPA:PHA), with a market cap of €890.96m. However, an important fact which most ignore is: how financially healthy is the business? Healthcare Services companies, even ones that are profitable, are inclined towards being higher risk. Evaluating financial health as part of your investment thesis is essential. Here are few basic financial health checks you should consider before taking the plunge. Nevertheless, I know these factors are very high-level, so I’d encourage you to dig deeper yourself into PHA here.
How much cash does PHA generate through its operations?
PHA has built up its total debt levels in the last twelve months, from €10.40m to €0 , which is made up of current and long term debt. With this increase in debt, PHA’s cash and short-term investments stands at €55.71m , ready to deploy into the business. On top of this, PHA has generated €27.48m in operating cash flow during the same period of time, leading to an operating cash to total debt ratio of 162.80%, meaning that PHA’s debt is appropriately covered by operating cash. This ratio can also be a sign of operational efficiency as an alternative to return on assets. In PHA’s case, it is able to generate 1.63x cash from its debt capital.
Does PHA’s liquid assets cover its short-term commitments?
With current liabilities at €36.74m, it seems that the business has been able to meet these obligations given the level of current assets of €90.16m, with a current ratio of 2.45x. Generally, for Healthcare Services companies, this is a reasonable ratio since there is a bit of a cash buffer without leaving too much capital in a low-return environment.
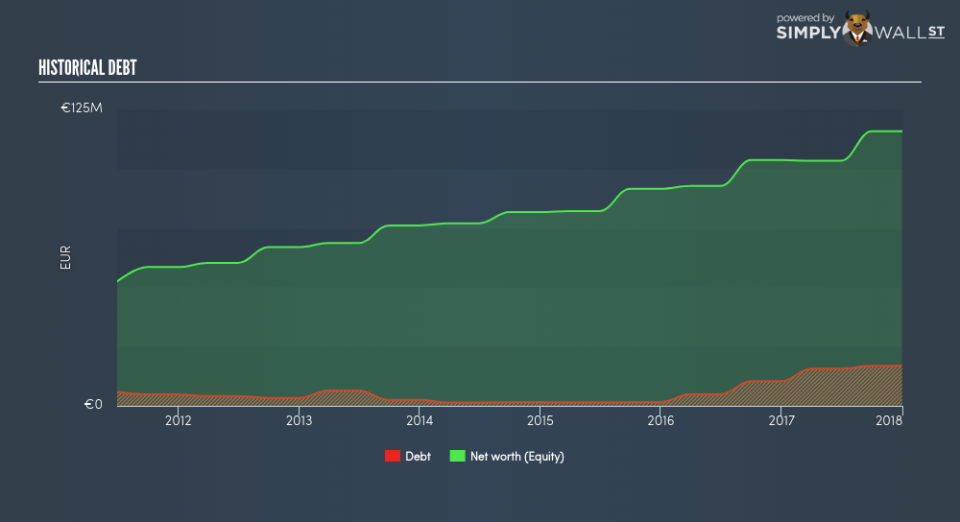
Is PHA’s debt level acceptable?
With a debt-to-equity ratio of 14.57%, PHA’s debt level may be seen as prudent. PHA is not taking on too much debt commitment, which can be restrictive and risky for equity-holders.
Next Steps:
PHA has demonstrated its ability to generate sufficient levels of cash flow, while its debt hovers at a safe level. Furthermore, the company will be able to pay all of its upcoming liabilities from its current short-term assets. I admit this is a fairly basic analysis for PHA’s financial health. Other important fundamentals need to be considered alongside. I recommend you continue to research Pharmagest Interactive to get a better picture of the stock by looking at:
Future Outlook: What are well-informed industry analysts predicting for PHA’s future growth? Take a look at our free research report of analyst consensus for PHA’s outlook.
Valuation: What is PHA worth today? Is the stock undervalued, even when its growth outlook is factored into its intrinsic value? The intrinsic value infographic in our free research report helps visualize whether PHA is currently mispriced by the market.
Other High-Performing Stocks: Are there other stocks that provide better prospects with proven track records? Explore our free list of these great stocks here.
To help readers see pass the short term volatility of the financial market, we aim to bring you a long-term focused research analysis purely driven by fundamental data. Note that our analysis does not factor in the latest price sensitive company announcements.
The author is an independent contributor and at the time of publication had no position in the stocks mentioned.
