
 Yahoo Finance
 The past five years for StarHub (SGX:CC3) investors has not been profitable
Ideally, your overall portfolio should beat the market average. But if you pick the right individual stocks, you could make more -- or less -- than that. While the StarHub Ltd (SGX:CC3) share price is down 26% over half a decade, the total return to shareholders (which includes dividends) was -5.5%. And that total return actually beats the market decline of 5.6%.
So let's have a look and see if the longer term performance of the company has been in line with the underlying business' progress.
See our latest analysis for StarHub
While markets are a powerful pricing mechanism, share prices reflect investor sentiment, not just underlying business performance. One flawed but reasonable way to assess how sentiment around a company has changed is to compare the earnings per share (EPS) with the share price.
During the five years over which the share price declined, StarHub's earnings per share (EPS) dropped by 5.9% each year. This change in EPS is remarkably close to the 6% average annual decrease in the share price. This implies that the market has had a fairly steady view of the stock. So it's fair to say the share price has been responding to changes in EPS.
You can see below how EPS has changed over time (discover the exact values by clicking on the image).
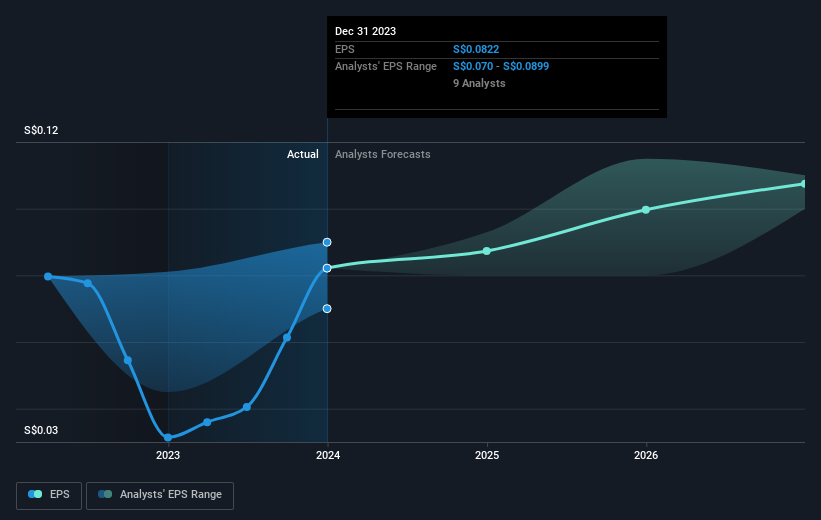
We know that StarHub has improved its bottom line lately, but is it going to grow revenue? Check if analysts think StarHub will grow revenue in the future.
What About Dividends?
When looking at investment returns, it is important to consider the difference between total shareholder return (TSR) and share price return. Whereas the share price return only reflects the change in the share price, the TSR includes the value of dividends (assuming they were reinvested) and the benefit of any discounted capital raising or spin-off. It's fair to say that the TSR gives a more complete picture for stocks that pay a dividend. We note that for StarHub the TSR over the last 5 years was -5.5%, which is better than the share price return mentioned above. The dividends paid by the company have thusly boosted the total shareholder return.
A Different Perspective
We're pleased to report that StarHub shareholders have received a total shareholder return of 19% over one year. Of course, that includes the dividend. Notably the five-year annualised TSR loss of 1.1% per year compares very unfavourably with the recent share price performance. The long term loss makes us cautious, but the short term TSR gain certainly hints at a brighter future. I find it very interesting to look at share price over the long term as a proxy for business performance. But to truly gain insight, we need to consider other information, too. Even so, be aware that StarHub is showing 2 warning signs in our investment analysis , you should know about...
If you would prefer to check out another company -- one with potentially superior financials -- then do not miss this free list of companies that have proven they can grow earnings.
Please note, the market returns quoted in this article reflect the market weighted average returns of stocks that currently trade on Singaporean exchanges.
Have feedback on this article? Concerned about the content? Get in touch with us directly. Alternatively, email editorial-team (at) simplywallst.com.
This article by Simply Wall St is general in nature. We provide commentary based on historical data and analyst forecasts only using an unbiased methodology and our articles are not intended to be financial advice. It does not constitute a recommendation to buy or sell any stock, and does not take account of your objectives, or your financial situation. We aim to bring you long-term focused analysis driven by fundamental data. Note that our analysis may not factor in the latest price-sensitive company announcements or qualitative material. Simply Wall St has no position in any stocks mentioned.