
 Yahoo Finance
 Parkson Retail Asia (SGX:O9E) Could Become A Multi-Bagger
If we want to find a potential multi-bagger, often there are underlying trends that can provide clues. Firstly, we'll want to see a proven return on capital employed (ROCE) that is increasing, and secondly, an expanding base of capital employed. This shows us that it's a compounding machine, able to continually reinvest its earnings back into the business and generate higher returns. With that in mind, the ROCE of Parkson Retail Asia (SGX:O9E) looks great, so lets see what the trend can tell us.
Return On Capital Employed (ROCE): What Is It?
For those who don't know, ROCE is a measure of a company's yearly pre-tax profit (its return), relative to the capital employed in the business. The formula for this calculation on Parkson Retail Asia is:
Return on Capital Employed = Earnings Before Interest and Tax (EBIT) ÷ (Total Assets - Current Liabilities)
0.38 = S$50m ÷ (S$295m - S$163m) (Based on the trailing twelve months to December 2023).
Therefore, Parkson Retail Asia has an ROCE of 38%. In absolute terms that's a great return and it's even better than the Multiline Retail industry average of 5.9%.
See our latest analysis for Parkson Retail Asia
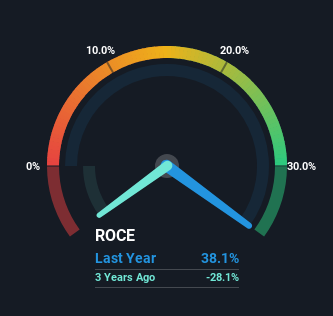
Historical performance is a great place to start when researching a stock so above you can see the gauge for Parkson Retail Asia's ROCE against it's prior returns. If you want to delve into the historical earnings , check out these free graphs detailing revenue and cash flow performance of Parkson Retail Asia.
What Can We Tell From Parkson Retail Asia's ROCE Trend?
We're delighted to see that Parkson Retail Asia is reaping rewards from its investments and is now generating some pre-tax profits. Shareholders would no doubt be pleased with this because the business was loss-making five years ago but is is now generating 38% on its capital. In addition to that, Parkson Retail Asia is employing 72% more capital than previously which is expected of a company that's trying to break into profitability. This can tell us that the company has plenty of reinvestment opportunities that are able to generate higher returns.
In another part of our analysis, we noticed that the company's ratio of current liabilities to total assets decreased to 55%, which broadly means the business is relying less on its suppliers or short-term creditors to fund its operations. This tells us that Parkson Retail Asia has grown its returns without a reliance on increasing their current liabilities, which we're very happy with. Nevertheless, there are some potential risks the company is bearing with current liabilities that high, so just keep that in mind.
What We Can Learn From Parkson Retail Asia's ROCE
In summary, it's great to see that Parkson Retail Asia has managed to break into profitability and is continuing to reinvest in its business. And with the stock having performed exceptionally well over the last five years, these patterns are being accounted for by investors. With that being said, we still think the promising fundamentals mean the company deserves some further due diligence.
If you want to continue researching Parkson Retail Asia, you might be interested to know about the 2 warning signs that our analysis has discovered.
If you want to search for more stocks that have been earning high returns, check out this free list of stocks with solid balance sheets that are also earning high returns on equity.
Have feedback on this article? Concerned about the content? Get in touch with us directly. Alternatively, email editorial-team (at) simplywallst.com.
This article by Simply Wall St is general in nature. We provide commentary based on historical data and analyst forecasts only using an unbiased methodology and our articles are not intended to be financial advice. It does not constitute a recommendation to buy or sell any stock, and does not take account of your objectives, or your financial situation. We aim to bring you long-term focused analysis driven by fundamental data. Note that our analysis may not factor in the latest price-sensitive company announcements or qualitative material. Simply Wall St has no position in any stocks mentioned.
