
 Yahoo Finance
 S&P 500 Trades At Two-Month Low: Where Is The Next Support?

The S&P 500’s descent below the 5,000 mark marks a two-month low, bringing the index’s worst monthly performance since December 2022 into sharp focus.
After closing in the red for the last six sessions, the index — tracked by the SPDR S&P 500 ETF Trust (NYSE:SPY) — is currently facing its worst losing streak since September 2022.
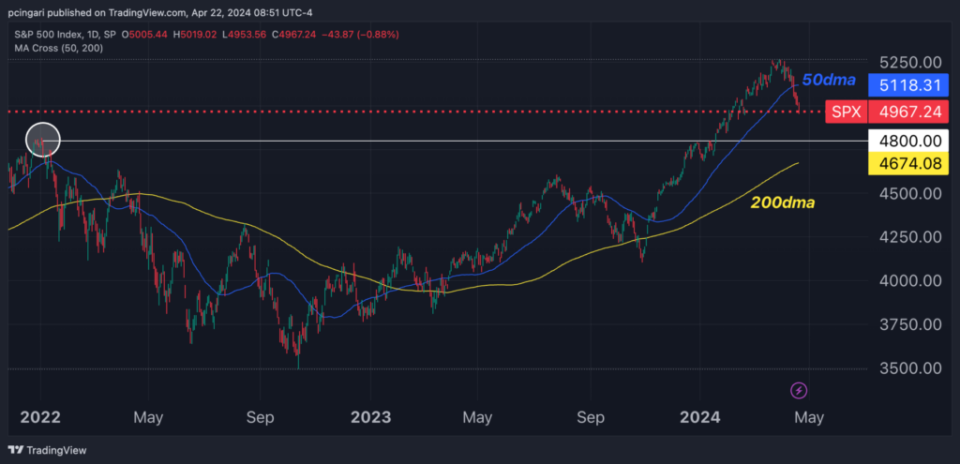
Furthermore, prices have slipped below the 50-day moving average, a bearish signal that may foretell further downturns.
As the market closed last Friday, the S&P 500’s drawdown was recorded at -5.5% from its most recent peak, though it remains up year-to-date and above its 2021 high.
Where does the current support lie? How much lower could the S&P 500 potentially fall?
S&P 500 Technical Analysis: Experts Eye 4,800 Levels
“Taking it into historical context, it's only registering as noise at the moment,” observed Callum Thomas, head of research and founder at Topdown Charts.
Given the past bearish breadth divergence, the recent fall below the 50-day moving average, and the breach of the 5,000-point support level, there’s a considerable chance the index could retest the 4,800 level, according to Thomas.
Also renewed veteran investor Ed Yardeni expected that a pullback up to 4,800 could be on the table at this juncture.
“It might reach around 4800, which would match the peak just before the previous bear market and put the index unchanged for the year so far,” he said in a recent note.
Further declines could see it approach the 200-day moving average, around 4,700, which would equate to a 10.6% correction from its all-time high, Yardeni added.
This week could extend the sell-off trend, but an unexpected drop in the March Personal Consumption Expenditure (PCE) inflation rate this Friday might pivot the market towards a robust rally.
S&P 500 Drawdowns Are Healthy, History Tells
Historically, market downturns are not uncommon, and for long-term investors, they present no grave threat.
Fred Alger Management, LLC, recently highlighted that “since 1990, the average drawdown in the S&P 500 has been 14% per calendar year, with drawdowns of at least 10% occurring in 19 of the past 34 years.”
Over the past half-century measured in trading days, the S&P 500 has spent nearly half (44%) of the time in correction territory, having fallen 10% or more from its previous high.
Despite these drawdowns, the index has still returned over 11% annually during this period, turning a hypothetical $10,000 investment into over $2 million. This supports the adage that “it's time in the market, not timing the market,” that counts.
Image: Shutterstock
"ACTIVE INVESTORS' SECRET WEAPON" Supercharge Your Stock Market Game with the #1 "news & everything else" trading tool: Benzinga Pro - Click here to start Your 14-Day Trial Now!
Get the latest stock analysis from Benzinga?
This article S&P 500 Trades At Two-Month Low: Where Is The Next Support? originally appeared on Benzinga.com
© 2024 Benzinga.com. Benzinga does not provide investment advice. All rights reserved.
