
 Yahoo Finance
 Is Oxford Industries, Inc.'s (NYSE:OXM) Recent Performance Tethered To Its Attractive Financial Prospects?
Oxford Industries' (NYSE:OXM) stock up by 8.4% over the past three months. Since the market usually pay for a company’s long-term financial health, we decided to study the company’s fundamentals to see if they could be influencing the market. Specifically, we decided to study Oxford Industries' ROE in this article.
Return on Equity or ROE is a test of how effectively a company is growing its value and managing investors’ money. Put another way, it reveals the company's success at turning shareholder investments into profits.
View our latest analysis for Oxford Industries
How Do You Calculate Return On Equity?
The formula for ROE is:
Return on Equity = Net Profit (from continuing operations) ÷ Shareholders' Equity
So, based on the above formula, the ROE for Oxford Industries is:
11% = US$61m ÷ US$561m (Based on the trailing twelve months to February 2024).
The 'return' is the yearly profit. Another way to think of that is that for every $1 worth of equity, the company was able to earn $0.11 in profit.
What Is The Relationship Between ROE And Earnings Growth?
So far, we've learned that ROE is a measure of a company's profitability. We now need to evaluate how much profit the company reinvests or "retains" for future growth which then gives us an idea about the growth potential of the company. Assuming everything else remains unchanged, the higher the ROE and profit retention, the higher the growth rate of a company compared to companies that don't necessarily bear these characteristics.
A Side By Side comparison of Oxford Industries' Earnings Growth And 11% ROE
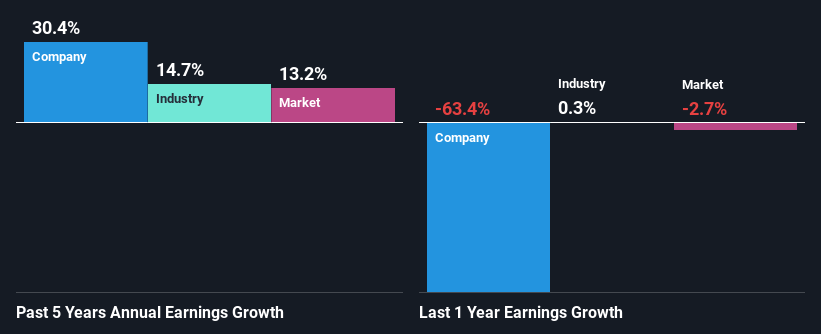
To start with, Oxford Industries' ROE looks acceptable. And on comparing with the industry, we found that the the average industry ROE is similar at 11%. This certainly adds some context to Oxford Industries' exceptional 30% net income growth seen over the past five years. We reckon that there could also be other factors at play here. For example, it is possible that the company's management has made some good strategic decisions, or that the company has a low payout ratio.
Next, on comparing with the industry net income growth, we found that Oxford Industries' growth is quite high when compared to the industry average growth of 15% in the same period, which is great to see.
Earnings growth is an important metric to consider when valuing a stock. The investor should try to establish if the expected growth or decline in earnings, whichever the case may be, is priced in. By doing so, they will have an idea if the stock is headed into clear blue waters or if swampy waters await. Is OXM fairly valued? This infographic on the company's intrinsic value has everything you need to know.
Is Oxford Industries Using Its Retained Earnings Effectively?
Oxford Industries' ' three-year median payout ratio is on the lower side at 21% implying that it is retaining a higher percentage (79%) of its profits. So it looks like Oxford Industries is reinvesting profits heavily to grow its business, which shows in its earnings growth.
Additionally, Oxford Industries has paid dividends over a period of at least ten years which means that the company is pretty serious about sharing its profits with shareholders. Our latest analyst data shows that the future payout ratio of the company is expected to rise to 32% over the next three years. Regardless, the future ROE for Oxford Industries is speculated to rise to 23% despite the anticipated increase in the payout ratio. There could probably be other factors that could be driving the future growth in the ROE.
Conclusion
In total, we are pretty happy with Oxford Industries' performance. In particular, it's great to see that the company is investing heavily into its business and along with a high rate of return, that has resulted in a sizeable growth in its earnings. The latest industry analyst forecasts show that the company is expected to maintain its current growth rate. To know more about the company's future earnings growth forecasts take a look at this free report on analyst forecasts for the company to find out more.
Have feedback on this article? Concerned about the content? Get in touch with us directly. Alternatively, email editorial-team (at) simplywallst.com.
This article by Simply Wall St is general in nature. We provide commentary based on historical data and analyst forecasts only using an unbiased methodology and our articles are not intended to be financial advice. It does not constitute a recommendation to buy or sell any stock, and does not take account of your objectives, or your financial situation. We aim to bring you long-term focused analysis driven by fundamental data. Note that our analysis may not factor in the latest price-sensitive company announcements or qualitative material. Simply Wall St has no position in any stocks mentioned.
