
 Yahoo Finance
 Overseas Education (SGX:RQ1) Could Be Struggling To Allocate Capital
There are a few key trends to look for if we want to identify the next multi-bagger. Firstly, we'd want to identify a growing return on capital employed (ROCE) and then alongside that, an ever-increasing base of capital employed. This shows us that it's a compounding machine, able to continually reinvest its earnings back into the business and generate higher returns. In light of that, when we looked at Overseas Education (SGX:RQ1) and its ROCE trend, we weren't exactly thrilled.
Understanding Return On Capital Employed (ROCE)
For those who don't know, ROCE is a measure of a company's yearly pre-tax profit (its return), relative to the capital employed in the business. To calculate this metric for Overseas Education, this is the formula:
Return on Capital Employed = Earnings Before Interest and Tax (EBIT) ÷ (Total Assets - Current Liabilities)
0.064 = S$15m ÷ (S$285m - S$55m) (Based on the trailing twelve months to December 2023).
Therefore, Overseas Education has an ROCE of 6.4%. Ultimately, that's a low return and it under-performs the Consumer Services industry average of 9.2%.
Check out our latest analysis for Overseas Education
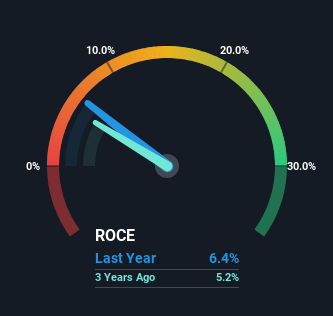
Historical performance is a great place to start when researching a stock so above you can see the gauge for Overseas Education's ROCE against it's prior returns. If you'd like to look at how Overseas Education has performed in the past in other metrics, you can view this free graph of Overseas Education's past earnings, revenue and cash flow.
The Trend Of ROCE
In terms of Overseas Education's historical ROCE movements, the trend isn't fantastic. To be more specific, ROCE has fallen from 11% over the last five years. However, given capital employed and revenue have both increased it appears that the business is currently pursuing growth, at the consequence of short term returns. If these investments prove successful, this can bode very well for long term stock performance.
On a side note, Overseas Education has done well to pay down its current liabilities to 19% of total assets. That could partly explain why the ROCE has dropped. Effectively this means their suppliers or short-term creditors are funding less of the business, which reduces some elements of risk. Since the business is basically funding more of its operations with it's own money, you could argue this has made the business less efficient at generating ROCE.
The Key Takeaway
In summary, despite lower returns in the short term, we're encouraged to see that Overseas Education is reinvesting for growth and has higher sales as a result. However, total returns to shareholders over the last five years have been flat, which could indicate these growth trends potentially aren't accounted for yet by investors. As a result, we'd recommend researching this stock further to uncover what other fundamentals of the business can show us.
If you want to know some of the risks facing Overseas Education we've found 3 warning signs (1 shouldn't be ignored!) that you should be aware of before investing here.
For those who like to invest in solid companies, check out this free list of companies with solid balance sheets and high returns on equity.
Have feedback on this article? Concerned about the content? Get in touch with us directly. Alternatively, email editorial-team (at) simplywallst.com.
This article by Simply Wall St is general in nature. We provide commentary based on historical data and analyst forecasts only using an unbiased methodology and our articles are not intended to be financial advice. It does not constitute a recommendation to buy or sell any stock, and does not take account of your objectives, or your financial situation. We aim to bring you long-term focused analysis driven by fundamental data. Note that our analysis may not factor in the latest price-sensitive company announcements or qualitative material. Simply Wall St has no position in any stocks mentioned.
