
 Yahoo Finance
 Is NuStar GP Holdings LLC (NYSE:NSH) A Financially Sound Company?

Investors are always looking for growth in small-cap stocks like NuStar GP Holdings LLC (NYSE:NSH), with a market cap of US$564.83m. However, an important fact which most ignore is: how financially healthy is the business? Oil and Gas companies, even ones that are profitable, are inclined towards being higher risk. Assessing first and foremost the financial health is vital. Here are few basic financial health checks you should consider before taking the plunge. Though, given that I have not delve into the company-specifics, I recommend you dig deeper yourself into NSH here.
Does NSH produce enough cash relative to debt?
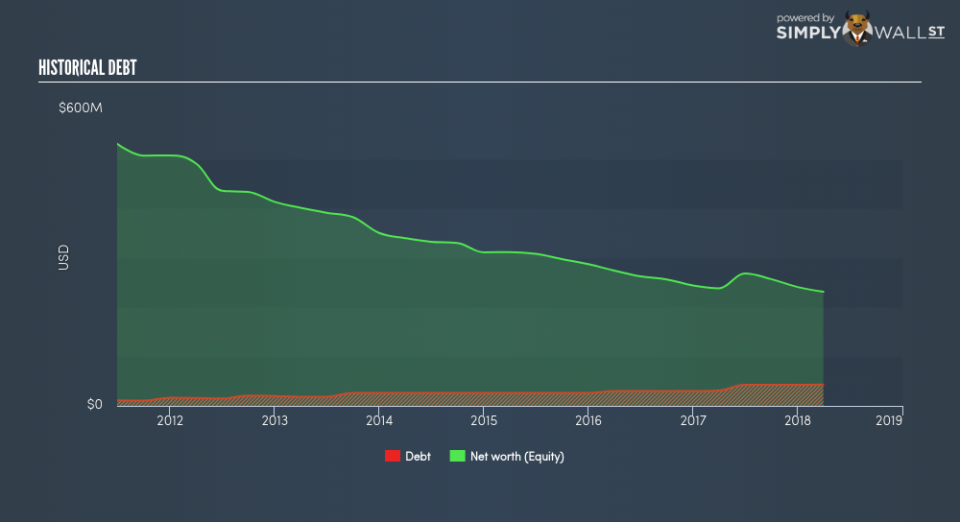
NSH has built up its total debt levels in the last twelve months, from US$30.00m to US$0 , which is mainly comprised of near term debt. With this rise in debt, NSH currently has US$422.00k remaining in cash and short-term investments for investing into the business. Additionally, NSH has produced cash from operations of US$47.79m during the same period of time, resulting in an operating cash to total debt ratio of 112.45%, signalling that NSH’s operating cash is sufficient to cover its debt. This ratio can also be a sign of operational efficiency as an alternative to return on assets. In NSH’s case, it is able to generate 1.12x cash from its debt capital.
Can NSH pay its short-term liabilities?
Looking at NSH’s most recent US$43.31m liabilities, it seems that the business has not been able to meet these commitments with a current assets level of US$872.00k, leading to a 0.02x current account ratio. which is under the appropriate industry ratio of 3x.
Is NSH’s debt level acceptable?
With a debt-to-equity ratio of 18.63%, NSH’s debt level may be seen as prudent. NSH is not taking on too much debt commitment, which may be constraining for future growth. We can check to see whether NSH is able to meet its debt obligations by looking at the net interest coverage ratio. A company generating earnings before interest and tax (EBIT) at least three times its net interest payments is considered financially sound. In NSH’s, case, the ratio of 24.37x suggests that interest is comfortably covered, which means that debtors may be willing to loan the company more money, giving NSH ample headroom to grow its debt facilities.
Next Steps:
NSH has demonstrated its ability to generate sufficient levels of cash flow, while its debt hovers at a safe level. But it is still important for shareholders to understand why the company isn’t increasing its cheaper cost of capital to fund future growth, especially if meeting short-term obligations could also bring about issues. Keep in mind I haven’t considered other factors such as how NSH has been performing in the past. I recommend you continue to research NuStar GP Holdings to get a more holistic view of the stock by looking at:
Future Outlook: What are well-informed industry analysts predicting for NSH’s future growth? Take a look at our free research report of analyst consensus for NSH’s outlook.
Valuation: What is NSH worth today? Is the stock undervalued, even when its growth outlook is factored into its intrinsic value? The intrinsic value infographic in our free research report helps visualize whether NSH is currently mispriced by the market.
Other High-Performing Stocks: Are there other stocks that provide better prospects with proven track records? Explore our free list of these great stocks here.
To help readers see pass the short term volatility of the financial market, we aim to bring you a long-term focused research analysis purely driven by fundamental data. Note that our analysis does not factor in the latest price sensitive company announcements.
The author is an independent contributor and at the time of publication had no position in the stocks mentioned.
