
 Yahoo Finance
 Nordson's (NDSN) Q2 Earnings Top Estimates, Revenues Rise Y/Y

Nordson Corporation’s NDSN second-quarter fiscal 2024 (ended Apr 30, 2024) adjusted earnings of $2.34 per share surpassed the Zacks Consensus Estimate of $2.30. The bottom line increased 13.3% year over year.
Revenue Details
Nordson’s revenues were $650.6 million, which were up 0.1% from the year-ago fiscal quarter’s number due to solid momentum in the Industrial Precision Solutions and Medical and Fluid Solutions segments. Revenues missed the Zacks Consensus Estimate of $658 million.
Organic sales declined 3.7% year over year due to softness in electronics product lines. Acquisitions/divestitures had a positive impact of 4.5%, while foreign currency translation had a negative impact of 0.7%.
On a regional basis, revenues from the Asia Pacific region decreased 14.4% year over year to $174.1 million. Revenues generated from Europe increased 8.4% to $182.1 million, while the metric in the Americas increased 5.6% to $294.4 million.
Nordson started reporting revenues under three segments effective Aug 1, 2022. The segments are Industrial Precision Solutions, Medical and Fluid Solutions, and Advanced Technology Solutions. A brief snapshot of the segmental sales is provided below:
Revenues from Industrial Precision Solutions amounted to $367 million, up 9.3% from the year-ago fiscal quarter’s level. The segment contributed 56.4% to NDSN’s top line in the quarter.
Organic sales increased 1.5% from the year-ago fiscal quarter’s level. Foreign currency translation had a negative impact of 0.8%.
Revenues from Medical and Fluid Solutions amounted to $169 million, up 1.5% from the year-ago fiscal quarter’s level. The segment contributed 26% to NDSN’s top line.
Organic sales increased 1.8% from the year-ago fiscal quarter’s level. Foreign currency translation had a negative impact of 0.3%.
Advanced Technology Solutions’ sales were $114.9 million, down 22.4% from the year-ago fiscal quarter’s figure. The metric represented 17.6% of Nordson’s revenues in the period.
Organic sales decreased 21.6% from the year-ago fiscal quarter’s level. Foreign currency translation had a negative impact of 0.8%.
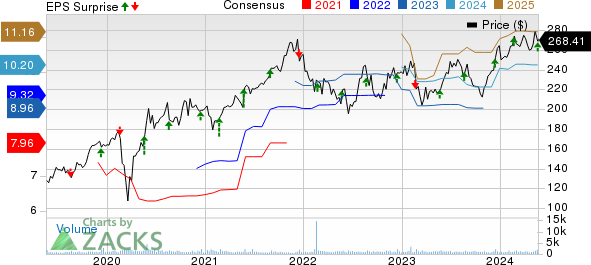
Nordson Corporation Price, Consensus and EPS Surprise
Nordson Corporation price-consensus-eps-surprise-chart | Nordson Corporation Quote
Margin Profile
Nordson’s cost of sales increased 4.5% from the year-ago fiscal quarter’s level to $284.8 million. Gross profit was $365.9 million, up 3.9% from the year-ago fiscal quarter’s level. The gross margin increased 200 basis points (bps) to 56.2%.
Selling and administrative expenses increased 9.8% year over year to $197.3 million. EBITDA was $203.4 million, the margin being 31%. Operating income was $168.6 million, up 2.3% year on year. Operating margin of 25.9% decreased 60 bps from the year-ago period.
Net interest expenses totaled $18.6 million, reflecting a 2% increase from the year-ago fiscal quarter’s level.
Balance Sheet & Cash Flow
At the time of exiting the second quarter, Nordson’s cash and cash equivalents were $125.4 million compared with $115.7 million recorded at the end of the fourth quarter of fiscal 2023. Long-term debt was $1.4 billion compared with $1.6 million recorded at the end of fourth-quarter fiscal 2023.
In the first six months of fiscal 2024, NDSN generated net cash of $295 million from operating activities, up 2.5% from the last fiscal year’s tally. Capital invested in purchasing property, plant and equipment totaled $21.9 million, up 42.7% from the year-ago fiscal period.
Dividends/Share Buyback
In the first six months of fiscal 2024, Nordson paid out dividends amounting to $77.8 million, up 4.5% from $74.5 million in the same period of the previous fiscal year.
Nordson’s treasury purchase shares amounted to $7.9 million in the first six months of fiscal 2024, which were down from $54.4 million in the last fiscal year.
Outlook
For the third quarter, NDSN expects sales in the range of $645-$670 million and adjusted earnings in the range of $2.25-$2.40 per share.
For fiscal 2024 (ending October 2024), Nordson anticipates adjusted earnings in the range of $9.35-$9.75 per share compared with $10.00-$10.50 per share predicted earlier. Sales are expected to increase in the range of 0-3% from the previous fiscal year’s reported number compared with an increase of 4-7% anticipated earlier.
Zacks Rank
The company currently carries a Zacks Rank #4 (Sell).
You can see the complete list of today’s Zacks #1 Rank (Strong Buy) stocks here.
Performance of Other Industrial Companies
IDEX Corporation’s IEX second-quarter adjusted earnings of $1.88 per share surpassed the Zacks Consensus Estimate of $1.75. On a year-over-year basis, the bottom line decreased approximately 10.1%.
IDEX’s net sales of $800.5 million underperformed the consensus estimate of $805 million. The top line also decreased 5.3% year over year.
A. O. Smith Corporation’s AOS second-quarter 2024 adjusted earnings of $1.00 per share surpassed the Zacks Consensus Estimate of 99 cents. The bottom line increased 6% on a year-over-year basis.
Net sales of $978.8 million missed the consensus estimate of $995 million. However, the top line inched up 1% year over year, driven by strong demand for commercial water heaters in North America.
W.W. Grainger, Inc. GWW has reported earnings per share of $9.62 in the second quarter, beating the Zacks Consensus Estimate of $9.58. The bottom line improved 0.1% year over year.
Grainger’s quarterly revenues rose 3.5% year over year to $4.24 billion. The top line missed the consensus estimate of $4.27 billion.
Want the latest recommendations from Zacks Investment Research? Today, you can download 7 Best Stocks for the Next 30 Days. Click to get this free report
A. O. Smith Corporation (AOS) : Free Stock Analysis Report
W.W. Grainger, Inc. (GWW) : Free Stock Analysis Report
IDEX Corporation (IEX) : Free Stock Analysis Report
Nordson Corporation (NDSN) : Free Stock Analysis Report
