
 Yahoo Finance
 Nordson (NDSN) Q2 Earnings Beat, Revenues Rise Y/Y

Nordson Corporation NDSN reported impressive second-quarter fiscal 2023 (ended Apr 30, 2023) results, wherein earnings beat the Zacks Consensus Estimate by 7.6% and sales beat the same by 1.9%.
NDSN’s adjusted earnings were $2.26 per share in the reported quarter, beating the Zacks Consensus Estimate of adjusted earnings of $2.10. The bottom line decreased 7% from $2.43 per share in the year-ago fiscal quarter.
Revenue Details
In the reported quarter, Nordson’s revenues were $650.2 million, reflecting an increase of 2.3% from the year-ago fiscal quarter’s number. Revenues beat the Zacks Consensus Estimate of $638 million.
Organic sales expanded 1.3%, driven by combined growth in Asia Pacific. Acquisitions/divestitures had a positive impact of 2.8% while foreign currency translation had a negative impact of 1.8%.
On a regional basis, revenues from the Asia Pacific region increased 7.5% to $203.5 million. Revenues generated from Europe decreased 2.5% to $167.9 million, while the metric in the Americas increased 1.8% to $278.7 million.
Nordson started reporting revenues under three segments effective Aug 1, 2022. The segments are Industrial Precision Solutions, Medical and Fluid Solutions, and Advanced Technology Solutions. A brief snapshot of the segmental sales is provided below:
Revenues from Industrial Precision Solutions amounted to $335.8 million in the quarter under review, up 6.1% from the year-ago fiscal quarter’s level. The segment contributed 51.6% to NDSN’s top line in the quarter.
Organic sales increased 8.5% from the year-ago fiscal quarter’s level. Foreign currency translation had a negative impact of 2.4%.
Revenues from Medical and Fluid Solutions amounted to $166.5 million in the quarter under review, down 3.3% from the year-ago fiscal quarter’s level. The segment contributed 25.6% to NDSN’s top line in the reported quarter.
Organic sales decreased 2.3% from the year-ago fiscal quarter’s level, while foreign currency translation had a negative impact of 1%.
Advanced Technology Solutions’ sales were $147.8 million, up 0.7% from the year-ago fiscal quarter’s figure. The metric represented 22.8% of Nordson’s revenues in the period.
Organic sales decreased 9.9% from the year-ago fiscal quarter’s level. Acquisitions/divestitures had a positive impact of 12.3%, while foreign currency translation had a negative impact of 1.7%.
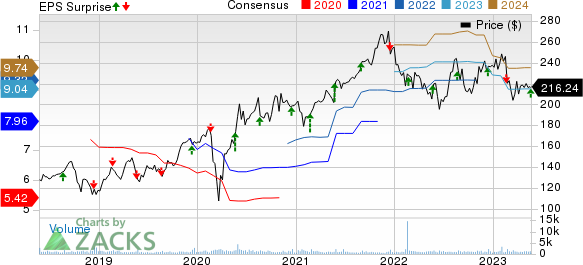
Nordson Corporation Price, Consensus and EPS Surprise
Nordson Corporation price-consensus-eps-surprise-chart | Nordson Corporation Quote
Margin Profile
In the reported quarter, Nordson’s cost of sales increased 7.3% from the year-ago fiscal quarter’s level to $298 million. The cost of sales represented 45.8% of net sales. Gross profit was $352.1 million, down 1.5% from the year-ago fiscal quarter’s level. The gross margin contracted 210 basis points (bps) to 54.2%. NDSN suffered the impacts of supply-chain woes and labor shortages.
Selling and administrative expenses increased 3.4% year over year to $179.6 million and represented 27.6% of net sales. EBITDA was $203 million, the margin being 31%. The adjusted operating income in the reported quarter was $175.9 million, decreasing 4.4% year on year. The adjusted operating margin decreased 200 bps to 27%.
Net interest expenses totaled $9.5 million, reflecting a 91.7% increase from the year-ago fiscal quarter’s level.
Balance Sheet & Cash Flow
At the time of exiting the fiscal second quarter, Nordson’s cash and cash equivalents reached $129.1 million, decreasing 21% from the $163.5 million recorded at the end of the fourth quarter of fiscal 2022. Long-term debt was $345.9 million, reflecting a 0.2% increase from $345.3 million.
In the first six months of fiscal 2023, NDSN generated net cash of $287.9 million from operating activities, up 34.2% from the last fiscal year’s tally. Capital invested in purchasing property, plant and equipment totaled $15.3 million, decreasing 38.1% from the year-ago fiscal period’s figure.
Dividends/Share Buyback
In the first six months of fiscal 2023, Nordson paid out dividends amounting to $74.5 million, up 25.6% from $59.3 million in the same period of the previous fiscal year.
Nordson’s treasury purchase shares amounted to $54.4 million in the first six months of fiscal 2023, decreasing from $140.5 million in the last fiscal year.
Outlook
For fiscal 2023 (ending October 2023), Nordson anticipates adjusted earnings to be $8.90-$9.30 per share compared with $8.75-$9.50 per share anticipated earlier. The midpoint of the guided range of $9.10 per share implies a 3.3% jump from the fiscal 2022 figure of $8.81 per share. Sales are expected to increase 0-3% from the previous fiscal year’s reported number.
Zacks Rank & Other Stocks to Consider
NDSN currently carries a Zacks Rank #2 (Buy). Some other top-ranked companies from the Industrial Products sector are discussed below:
Ingersoll Rand Inc. IR presently sports a Zacks Rank #1 (Strong Buy). You can see the complete list of today’s Zacks #1 Rank stocks.
IR delivered a trailing four-quarter earnings surprise of 12.6%, on average. In the past 60 days, estimates for Ingersoll Rand’s 2023 earnings have increased 6%. The stock has improved 11.3% in the past six months.
Alamo Group Inc. ALG presently sports a Zacks Rank of 1. ALG delivered a trailing four-quarter earnings surprise of 17.7%, on average.
In the past 60 days, estimates for Alamo’s 2023 earnings have increased 12.7%. The stock has gained 20.5% in the past six months.
Want the latest recommendations from Zacks Investment Research? Today, you can download 7 Best Stocks for the Next 30 Days. Click to get this free report
Ingersoll Rand Inc. (IR) : Free Stock Analysis Report
Nordson Corporation (NDSN) : Free Stock Analysis Report
Alamo Group, Inc. (ALG) : Free Stock Analysis Report
