
 Yahoo Finance
 Nordic Group (SGX:MR7) Is Looking To Continue Growing Its Returns On Capital
Did you know there are some financial metrics that can provide clues of a potential multi-bagger? Firstly, we'd want to identify a growing return on capital employed (ROCE) and then alongside that, an ever-increasing base of capital employed. Put simply, these types of businesses are compounding machines, meaning they are continually reinvesting their earnings at ever-higher rates of return. Speaking of which, we noticed some great changes in Nordic Group's (SGX:MR7) returns on capital, so let's have a look.
Understanding Return On Capital Employed (ROCE)
For those that aren't sure what ROCE is, it measures the amount of pre-tax profits a company can generate from the capital employed in its business. Analysts use this formula to calculate it for Nordic Group:
Return on Capital Employed = Earnings Before Interest and Tax (EBIT) ÷ (Total Assets - Current Liabilities)
0.15 = S$19m ÷ (S$266m - S$136m) (Based on the trailing twelve months to December 2023).
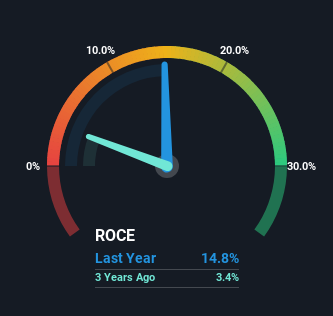
So, Nordic Group has an ROCE of 15%. In absolute terms, that's a satisfactory return, but compared to the Construction industry average of 8.0% it's much better.
See our latest analysis for Nordic Group
While the past is not representative of the future, it can be helpful to know how a company has performed historically, which is why we have this chart above. If you're interested in investigating Nordic Group's past further, check out this free graph covering Nordic Group's past earnings, revenue and cash flow.
The Trend Of ROCE
We like the trends that we're seeing from Nordic Group. The data shows that returns on capital have increased substantially over the last five years to 15%. The company is effectively making more money per dollar of capital used, and it's worth noting that the amount of capital has increased too, by 38%. This can indicate that there's plenty of opportunities to invest capital internally and at ever higher rates, a combination that's common among multi-baggers.
For the record though, there was a noticeable increase in the company's current liabilities over the period, so we would attribute some of the ROCE growth to that. Effectively this means that suppliers or short-term creditors are now funding 51% of the business, which is more than it was five years ago. And with current liabilities at those levels, that's pretty high.
Our Take On Nordic Group's ROCE
A company that is growing its returns on capital and can consistently reinvest in itself is a highly sought after trait, and that's what Nordic Group has. Since the stock has only returned 24% to shareholders over the last five years, the promising fundamentals may not be recognized yet by investors. Given that, we'd look further into this stock in case it has more traits that could make it multiply in the long term.
If you'd like to know about the risks facing Nordic Group, we've discovered 1 warning sign that you should be aware of.
While Nordic Group may not currently earn the highest returns, we've compiled a list of companies that currently earn more than 25% return on equity. Check out this free list here.
Have feedback on this article? Concerned about the content? Get in touch with us directly. Alternatively, email editorial-team (at) simplywallst.com.
This article by Simply Wall St is general in nature. We provide commentary based on historical data and analyst forecasts only using an unbiased methodology and our articles are not intended to be financial advice. It does not constitute a recommendation to buy or sell any stock, and does not take account of your objectives, or your financial situation. We aim to bring you long-term focused analysis driven by fundamental data. Note that our analysis may not factor in the latest price-sensitive company announcements or qualitative material. Simply Wall St has no position in any stocks mentioned.
