
 Yahoo Finance
 Nokia (NOK) Q1 Earnings Meet Estimates, Revises Outlook
Nokia Corporation NOK reported decent first-quarter 2020 results, with the bottom line improving year over year and meeting the Zacks Consensus Estimate.
The company has been focusing on Mobile Access and cash generation as well as saw good progress in both areas in the first quarter. Nokia continues to register growth in ‘5G Powered by ReefShark’ and product cost reductions are proceeding well.
Bottom Line
Reported loss for the March quarter was €100 million or loss of €0.02 per share compared with a loss of €442 million or loss of €0.08 per share in the year-ago quarter. The improvement was primarily driven by higher gross profit in Mobile Access within Networks and Software, lower amortization and progress related to cost-saving program. However, the momentum was partially offset by higher investments in 5G R&D to accelerate product roadmaps and cost competitiveness in Mobile Access, income taxes and a net negative fluctuation in Nokia’s venture fund investments.
Quarterly non-IFRS profit came in at €33 million ($36.4 million) or €0.01 (1 cent) per share against a loss of €116 million or loss of €0.02 per share in the prior-year quarter. The bottom line matched the Zacks Consensus Estimate.
Nokia Corporation Price, Consensus and EPS Surprise
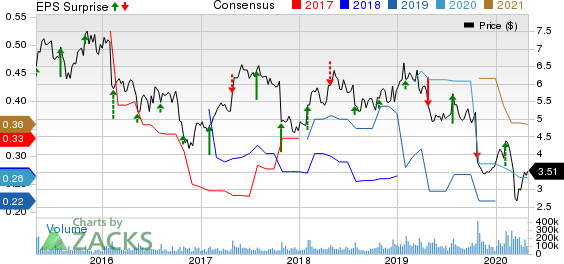
Nokia Corporation price-consensus-eps-surprise-chart | Nokia Corporation Quote
Revenues
On a reported basis, net sales for the quarter dropped 2.4% year over year to €4,913 million. This reflects good operational performance and the competitiveness of Nokia’s offerings, given the negative impact of COVID-19 on the overall market environment. The company estimates that COVID-19 had an almost €200 million negative impact on net sales, largely due to supply issues associated with disruptions in China.
While net sales increased in Middle East & Africa and North America (up 9% and 3%, respectively), net sales declined in Europe, Asia-Pacific, Greater China and Latin America (down 3%, 1%, 29% and 7%, respectively).
First-quarter non-IFRS net sales were €4,914 million ($5,419.5 million) compared with €5,057 million in the prior-year quarter. The top line lagged the consensus estimate of $5,776 million.
Segment Results
Net sales in Networks (which accounts for the lion’s share of total revenues) fell 5% year over year to €3,757 million ($4,143.5 million). This was due to Fixed Access, IP Routing, Mobile Access and, to a lesser extent, Optical Networks. The segment’s gross margin surged 350 basis points (bps) to 30.4%. Operating margin increased 420 bps year over year to a negative 2.2%.
The decrease in Fixed Access was primarily due to digital home in China and copper access technologies in Europe. The year-over-year decline in IP Routing was due to a particularly strong first-quarter 2019, which benefitted from pent up demand for some of the newly-introduced FP4 products. The decline in Mobile Access was due to fall in legacy radio technologies and network deployment services, partially offset by strong growth in 5G. The slight deterioration in Optical Networks was caused by temporary supply-chain constraints.
Net sales in Nokia Software were up 12.9% year over year to €613 million ($676.1 million), driven by strong sales execution and the comprehensiveness of Nokia’s portfolio. This shows progress against the company’s strategy to strengthen Nokia Software, delivering robust performance across the product portfolio and in four out of six regions. Nokia Software offers leading cloud-native, multi-vendor and multi-network solutions combined with a partner ecosystem. The segment’s gross margin soared 990 bps to 50.2%. Operating margin increased 1,270 bps to 11.4%.
Net sales in Nokia Technologies fell 6.2% year over year to €347 million ($382.7 million). This was primarily due to lower one-time net sales and lower brand licensing net sales, partially offset by higher net sales related to new licensing agreements. One-time net sales amounted to about €10 million in first-quarter 2020 and €40 million in the year-ago quarter. The segment’s gross margin improved 290 bps to 99.4%. Operating margin rose 200 bps to 83.6%.
In Group Common and Other, net sales declined 6.8% year over year to €205 million ($226.1 million). This was primarily due to Radio Frequency Systems, partially offset by growth in Alcatel Submarine Networks. The downtick in Radio Frequency Systems was due to lower net sales in North America. The growth in Alcatel Submarine Networks was led by new projects. The segment’s gross margin was a negative 4.9%, down 670 bps.
Other Details
Overall non-IFRS cost of sales fell to €3,127 million from €3,416 million in the year-ago quarter. Non-IFRS gross profit increased 8.9% year over year to €1,787 million, attributable to higher gross margin in Mobile Access within Networks and Nokia Software. Non-IFRS operating profit was €116 million against an operating loss of €59 million in the year-ago quarter. Nokia currently has 70 commercial 5G deals and 21 live networks.
Cash Flow & Liquidity
In the first quarter, Nokia generated €134 million of net cash from operations against a cash utilization of €747 million in the year-ago quarter. As of Mar 31, the Finland-based telecom gear maker had €6,159 million ($6,774.6 million) in cash and equivalents with €4,157 million ($4,572.5 million) of long-term interest-bearing liabilities compared with the respective tallies of €5,862 million and €3,650 million a year ago.
Outlook Revised
Nokia has adjusted the mid-points within its previously-disclosed outlook ranges for 2020 to reflect the increased risks and uncertainty caused by the COVID-19 pandemic. It expects the majority of this impact to be in the ongoing quarter.
In 2020, Nokia now expects non-IFRS earnings per share of €0.23 (+/- 5 cents), adjusted from earlier expectation of €0.25. Non-IFRS operating margin is now estimated to be 9% (+/- 1.5 percentage points), changed from earlier expectation of 9.5%. The company continues to expect a long-term (3 to 5 years) non-IFRS operating margin between 12% and 14%.
Conversion rate used:
€1 = $1.102875 (period average from Jan 1, 2020 to Mar 31, 2020)
€1 = $1.099954 (as of Mar 31, 2020)
Zacks Rank & Stocks to Consider
Nokia currently has a Zacks Rank #3 (Hold).
Some better-ranked stocks in the industry are Ooma, Inc. OOMA, Turtle Beach Corporation HEAR and Plantronics, Inc. PLT. While Ooma sports a Zacks Rank #1 (Strong Buy), Turtle Beach and Plantronics carry a Zacks Rank #2 (Buy). You can see the complete list of today’s Zacks #1 Rank stocks here.
Ooma has a trailing four-quarter positive earnings surprise of 124%, on average.
Turtle Beach has a trailing four-quarter positive earnings surprise of 112.5%, on average.
Plantronics has a trailing four-quarter positive earnings surprise of 27.7%, on average. The company’s earnings beat the Zacks Consensus Estimate in three of the last four quarters.
Today's Best Stocks from Zacks
Would you like to see the updated picks from our best market-beating strategies? From 2017 through 2019, while the S&P 500 gained an impressive +53.6%, five of our strategies returned +65.8%, +97.1%, +118.0%, +175.7% and even +186.7%.
This outperformance has not just been a recent phenomenon. From 2000 – 2019, while the S&P averaged +6.0% per year, our top strategies averaged up to +54.7% per year.
See their latest picks free >>
Want the latest recommendations from Zacks Investment Research? Today, you can download 7 Best Stocks for the Next 30 Days. Click to get this free report
Nokia Corporation (NOK) : Free Stock Analysis Report
Turtle Beach Corporation (HEAR) : Free Stock Analysis Report
Plantronics, Inc. (PLT) : Free Stock Analysis Report
Ooma, Inc. (OOMA) : Free Stock Analysis Report
To read this article on Zacks.com click here.
Zacks Investment Research
