
 Yahoo Finance
 Nedbank Group Ltd's Dividend Analysis
Understanding the Dividend Prospects of Nedbank Group Ltd (NDBKY)
Nedbank Group Ltd (NDBKY) recently announced a dividend of $0.55 per share, payable on 2024-04-25, with the ex-dividend date set for 2024-04-11. As investors look forward to this upcoming payment, the spotlight also shines on the company's dividend history, yield, and growth rates. Using the data from GuruFocus, let's delve into Nedbank Group Ltd's dividend performance and assess its sustainability.
What Does Nedbank Group Ltd Do?
This Powerful Chart Made Peter Lynch 29% A Year For 13 Years
How to calculate the intrinsic value of a stock?
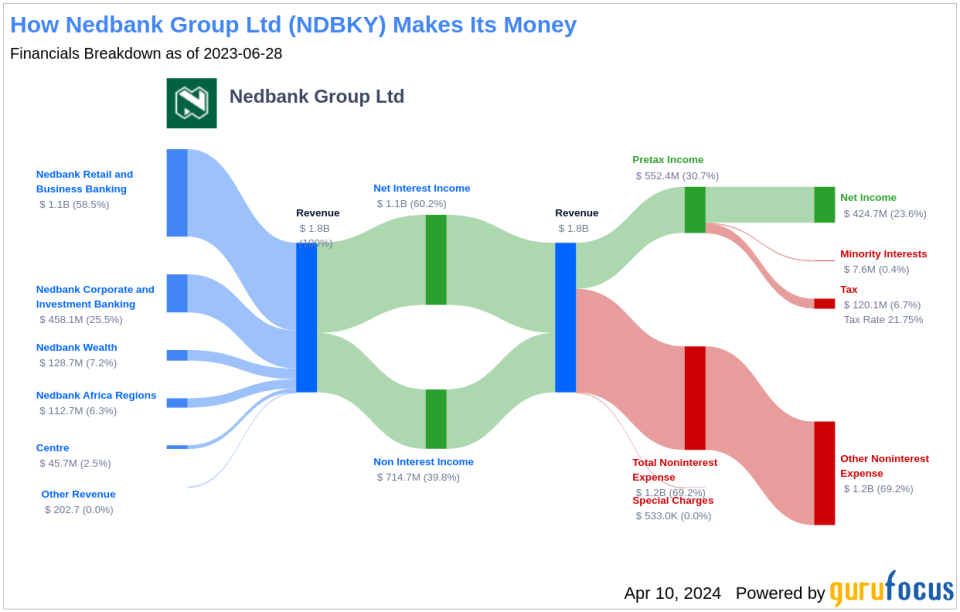
Nedbank Group Ltd is a financial services provider that offers corporate, retail, and investment banking services; insurance; asset management; and wealth management. It operates predominantly in South Africa. Net interest income from lending activities accounts for roughly half of the company's total revenue. Its operating segments include Nedbank Corporate and Investment Banking, Nedbank Retail and Business Banking, Nedbank Wealth, Nedbank Africa Regions, and Centre.
A Glimpse at Nedbank Group Ltd's Dividend History
Nedbank Group Ltd has maintained a consistent dividend payment record since 2003. Dividends are currently distributed on a bi-annual basis. Below is a chart showing annual Dividends Per Share for tracking historical trends.

Breaking Down Nedbank Group Ltd's Dividend Yield and Growth
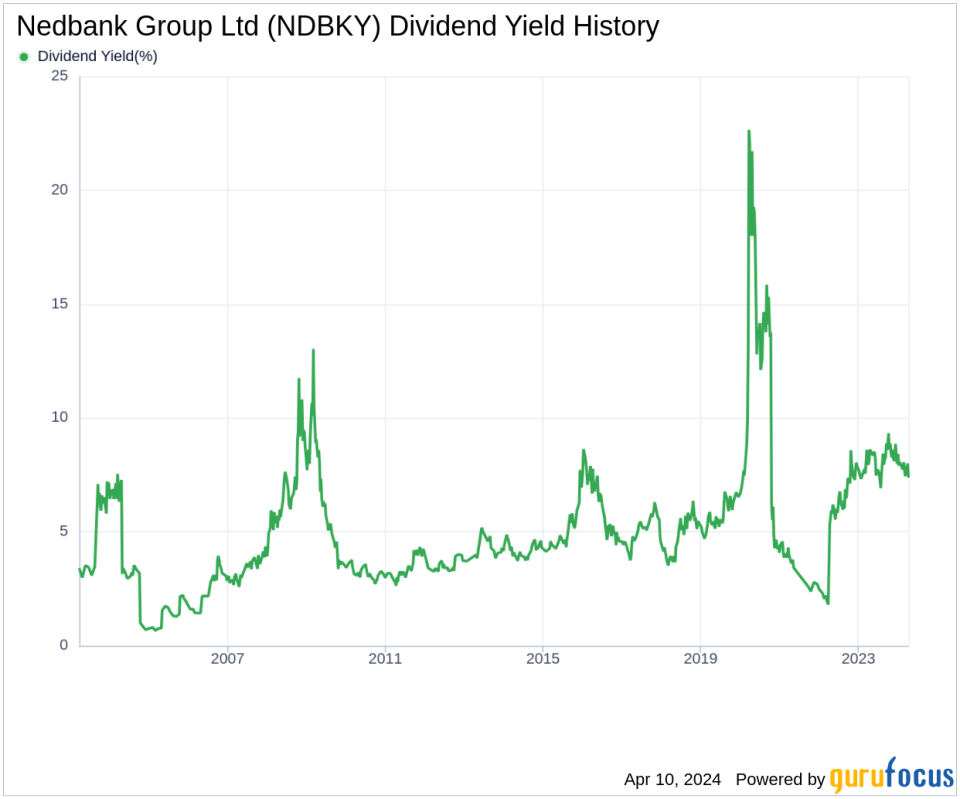
As of today, Nedbank Group Ltd currently has a 12-month trailing dividend yield of 7.38% and a 12-month forward dividend yield of 7.96%. This suggests an expectation of increased dividend payments over the next 12 months. Over the past three years, Nedbank Group Ltd's annual dividend growth rate was 35.70%. Extended to a five-year horizon, this rate decreased to 2.70% per year. And over the past decade, Nedbank Group Ltd's annual dividends per share growth rate stands at 1.90%.
Based on Nedbank Group Ltd's dividend yield and five-year growth rate, the 5-year yield on cost of Nedbank Group Ltd stock as of today is approximately 8.43%.
The Sustainability Question: Payout Ratio and Profitability
To assess the sustainability of the dividend, one needs to evaluate the company's payout ratio. The dividend payout ratio provides insights into the portion of earnings the company distributes as dividends. A lower ratio suggests that the company retains a significant part of its earnings, thereby ensuring the availability of funds for future growth and unexpected downturns. As of 2023-12-31, Nedbank Group Ltd's dividend payout ratio is 0.54.
Nedbank Group Ltd's profitability rank, offers an understanding of the company's earnings prowess relative to its peers. GuruFocus ranks Nedbank Group Ltd's profitability 6 out of 10 as of 2023-12-31, suggesting fair profitability. The company has reported positive net income for each of year over the past decade, further solidifying its high profitability.
Growth Metrics: The Future Outlook
To ensure the sustainability of dividends, a company must have robust growth metrics. Nedbank Group Ltd's growth rank of 6 out of 10 suggests that the company has a fair growth outlook. Revenue is the lifeblood of any company, and Nedbank Group Ltd's revenue per share, combined with the 3-year revenue growth rate, indicates a strong revenue model. Nedbank Group Ltd's revenue has increased by approximately 10.00% per year on average, a rate that outperforms approximately 63.71% of global competitors.
The company's 3-year EPS growth rate showcases its capability to grow its earnings, a critical component for sustaining dividends in the long run. During the past three years, Nedbank Group Ltd's earnings increased by approximately 42.20% per year on average, a rate that outperforms approximately 86.36% of global competitors. Lastly, the company's 5-year EBITDA growth rate of 5.30%, which outperforms approximately 41.48% of global competitors.
Next Steps
In conclusion, Nedbank Group Ltd's dividend payments appear to be on solid ground, backed by a consistent record of payouts, a robust dividend yield, and a reasonable payout ratio. The company's profitability and positive growth metrics provide further assurance of its ability to sustain and potentially grow its dividends in the future. Investors considering Nedbank Group Ltd for its dividend prospects should also take note of the company's fair growth outlook, which complements its financial stability. As the financial landscape evolves, keeping an eye on these factors will be crucial for value investors seeking to make informed decisions.
GuruFocus Premium users can screen for high-dividend yield stocks using the High Dividend Yield Screener.
This article, generated by GuruFocus, is designed to provide general insights and is not tailored financial advice. Our commentary is rooted in historical data and analyst projections, utilizing an impartial methodology, and is not intended to serve as specific investment guidance. It does not formulate a recommendation to purchase or divest any stock and does not consider individual investment objectives or financial circumstances. Our objective is to deliver long-term, fundamental data-driven analysis. Be aware that our analysis might not incorporate the most recent, price-sensitive company announcements or qualitative information. GuruFocus holds no position in the stocks mentioned herein.
This article first appeared on GuruFocus.
