
 Yahoo Finance
 National Beverage Corp.'s (NASDAQ:FIZZ) Fundamentals Look Pretty Strong: Could The Market Be Wrong About The Stock?
It is hard to get excited after looking at National Beverage's (NASDAQ:FIZZ) recent performance, when its stock has declined 4.6% over the past week. However, stock prices are usually driven by a company’s financials over the long term, which in this case look pretty respectable. Specifically, we decided to study National Beverage's ROE in this article.
Return on equity or ROE is an important factor to be considered by a shareholder because it tells them how effectively their capital is being reinvested. In simpler terms, it measures the profitability of a company in relation to shareholder's equity.
Check out our latest analysis for National Beverage
How Is ROE Calculated?
The formula for return on equity is:
Return on Equity = Net Profit (from continuing operations) ÷ Shareholders' Equity
So, based on the above formula, the ROE for National Beverage is:
33% = US$169m ÷ US$510m (Based on the trailing twelve months to January 2024).
The 'return' is the yearly profit. That means that for every $1 worth of shareholders' equity, the company generated $0.33 in profit.
What Is The Relationship Between ROE And Earnings Growth?
We have already established that ROE serves as an efficient profit-generating gauge for a company's future earnings. Based on how much of its profits the company chooses to reinvest or "retain", we are then able to evaluate a company's future ability to generate profits. Assuming all else is equal, companies that have both a higher return on equity and higher profit retention are usually the ones that have a higher growth rate when compared to companies that don't have the same features.
A Side By Side comparison of National Beverage's Earnings Growth And 33% ROE
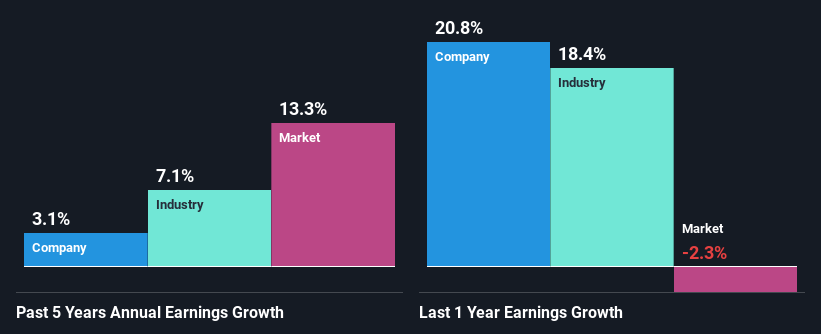
First thing first, we like that National Beverage has an impressive ROE. Additionally, the company's ROE is higher compared to the industry average of 19% which is quite remarkable. Yet, National Beverage has posted measly growth of 3.1% over the past five years. This is generally not the case as when a company has a high rate of return it should usually also have a high earnings growth rate. We reckon that a low growth, when returns are quite high could be the result of certain circumstances like low earnings retention or or poor allocation of capital.
We then compared National Beverage's net income growth with the industry and found that the company's growth figure is lower than the average industry growth rate of 7.1% in the same 5-year period, which is a bit concerning.
Earnings growth is a huge factor in stock valuation. It’s important for an investor to know whether the market has priced in the company's expected earnings growth (or decline). Doing so will help them establish if the stock's future looks promising or ominous. One good indicator of expected earnings growth is the P/E ratio which determines the price the market is willing to pay for a stock based on its earnings prospects. So, you may want to check if National Beverage is trading on a high P/E or a low P/E, relative to its industry.
Is National Beverage Making Efficient Use Of Its Profits?
Summary
In total, it does look like National Beverage has some positive aspects to its business. Yet, the low earnings growth is a bit concerning, especially given that the company has a high rate of return and is reinvesting ma huge portion of its profits. By the looks of it, there could be some other factors, not necessarily in control of the business, that's preventing growth. While we won't completely dismiss the company, what we would do, is try to ascertain how risky the business is to make a more informed decision around the company. You can see the 2 risks we have identified for National Beverage by visiting our risks dashboard for free on our platform here.
Have feedback on this article? Concerned about the content? Get in touch with us directly. Alternatively, email editorial-team (at) simplywallst.com.
This article by Simply Wall St is general in nature. We provide commentary based on historical data and analyst forecasts only using an unbiased methodology and our articles are not intended to be financial advice. It does not constitute a recommendation to buy or sell any stock, and does not take account of your objectives, or your financial situation. We aim to bring you long-term focused analysis driven by fundamental data. Note that our analysis may not factor in the latest price-sensitive company announcements or qualitative material. Simply Wall St has no position in any stocks mentioned.
