
 Yahoo Finance
 What You Must Know About Ocado Group plc’s (LON:OCDO) Return on Equity

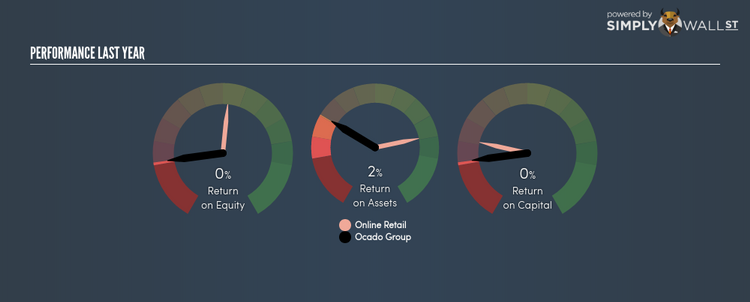
Ocado Group plc’s (LSE:OCDO) most recent return on equity was a substandard 0.37% relative to its industry performance of 16.92% over the past year. Though OCDO’s recent performance is underwhelming, it is useful to understand what ROE is made up of and how it should be interpreted. Knowing these components can change your views on OCDO’s below-average returns. I will take you through how metrics such as financial leverage impact ROE which may affect the overall sustainability of OCDO’s returns. View our latest analysis for Ocado Group
Breaking down ROE — the mother of all ratios
Return on Equity (ROE) weighs Ocado Group’s profit against the level of its shareholders’ equity. It essentially shows how much the company can generate in earnings given the amount of equity it has raised. Generally speaking, a higher ROE is preferred; however, there are other factors we must also consider before making any conclusions.
Return on Equity = Net Profit ÷ Shareholders Equity
ROE is measured against cost of equity in order to determine the efficiency of Ocado Group’s equity capital deployed. Its cost of equity is 8.93%. Since Ocado Group’s return does not cover its cost, with a difference of -8.56%, this means its current use of equity is not efficient and not sustainable. Very simply, Ocado Group pays more for its capital than what it generates in return. ROE can be dissected into three distinct ratios: net profit margin, asset turnover, and financial leverage. This is called the Dupont Formula:
Dupont Formula
ROE = profit margin × asset turnover × financial leverage
ROE = (annual net profit ÷ sales) × (sales ÷ assets) × (assets ÷ shareholders’ equity)
ROE = annual net profit ÷ shareholders’ equity
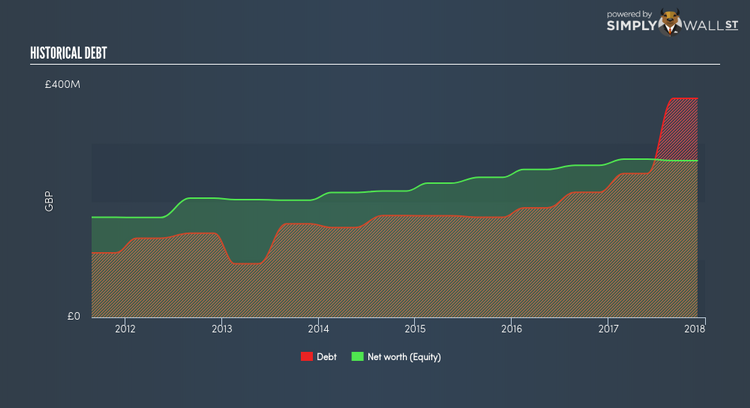
Basically, profit margin measures how much of revenue trickles down into earnings which illustrates how efficient the business is with its cost management. Asset turnover shows how much revenue Ocado Group can generate with its current asset base. The most interesting ratio, and reflective of sustainability of its ROE, is financial leverage. Since ROE can be inflated by excessive debt, we need to examine Ocado Group’s debt-to-equity level. At 139.64%, Ocado Group’s debt-to-equity ratio appears balanced and indicates its ROE is generated from its capacity to increase profit without a large debt burden.
Next Steps:
ROE is a simple yet informative ratio, illustrating the various components that each measure the quality of the overall stock. Ocado Group exhibits a weak ROE against its peers, as well as insufficient levels to cover its own cost of equity this year. Although, its appropriate level of leverage means investors can be more confident in the sustainability of Ocado Group’s return with a possible increase should the company decide to increase its debt levels. ROE is a helpful signal, but it is definitely not sufficient on its own to make an investment decision.
For Ocado Group, there are three relevant aspects you should further research:
Financial Health: Does it have a healthy balance sheet? Take a look at our free balance sheet analysis with six simple checks on key factors like leverage and risk.
Management:Have insiders been ramping up their shares to take advantage of the market’s sentiment for Ocado Group’s future outlook? Check out our management and board analysis with insights on CEO compensation and governance factors.
Other High-Growth Alternatives : Are there other high-growth stocks you could be holding instead of Ocado Group? Explore our interactive list of stocks with large growth potential to get an idea of what else is out there you may be missing!
To help readers see pass the short term volatility of the financial market, we aim to bring you a long-term focused research analysis purely driven by fundamental data. Note that our analysis does not factor in the latest price sensitive company announcements.
The author is an independent contributor and at the time of publication had no position in the stocks mentioned.
