How Much Are HDB Resale Prices Really Dropping By?
For almost every week the past few weeks, we have been reading on mainstream media that HDB resale prices are dropping.
For example, here is a news report from ChannelNewsAsia last week about the recent decline of prices. At the start of October, Business Times also reported that HDB prices index have dipped in the 3rd quarter of 2015 (3Q2015). 3 months ago, a somewhat similar story from TodayOnline also mentioned that resale prices are at the lowest point in 1.5 years.
These are just a few examples of the numerous articles we have been reading recently.
With the barrage of news being reported by the various news outlets, a layperson could be forgiven for thinking that HDB prices are now coming down to affordable levels. That must be the reason why the media is so happy with them.
Laypeople could also start reasoning that the government has done a great job, the cooling measures are working and young people can easily afford homes now.
But we didn’t want to jump the gun – we needed to look at the situation a little bit closer to see just how much have prices come down. We use some of the key indicators to figure this out.
Multiple Indicators For HDB Resale Prices
The first thing you need to know is that most media in Singapore rely on two sources for their information about HDB prices.
1. Resale Price Index (By HDB):
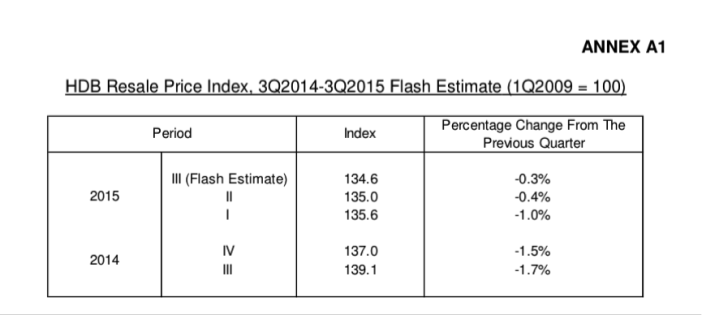
The first is the HDB Resale Price Index, reported by HDB themselves. This is published on a quarterly basis.
Source: HDB
One of the things to take note of is that the price index is published every 3 months.
2. Singapore Real Estate Exchange Property Index (SPI) (By StreetSine):
If you read some of the articles reported by the media, you would have noticed that some of the news about HDB prices took reference from the SPI. The SPI is an index created by StreetSine Technology Group, which happens to be 60% owned by Singapore Press Holdings (SPH).
The main advantage, which SPI has over the HDB’s Resale Price Index, is that it publishes monthly report.
Source: SRX
Key Observations On Trend
While there are some slight differences between the two reports (for example, HDB shows 137.0 for 4Q2014 while SPI shows a 3-month moving average of 138.0 for 4Q2014), the differences is not significant enough for us to bother about which index is more accurate.
The general trend for both is similar. They both show a downwards-sliding trend for HDB property prices. With multiple media reporting the news from both these sources regularly, it is no surprise that we are being constantly being bomboarded with the news that HDB prices are dropping.
But just how significant have this decline actually been?
How Much Have HDB Prices Really Dropped?
One thing to know is that both indices have the price from 1Q2009 as the base mark price of 100. So when you see a figure like 137.0, it refers to prices being about 37% more expensive than the price it was in 1Q2009.
With that being understood, let’s now do some maths.
According to the SPI, prices peaked in April 2013 at 152.3, a frankly shocking rate of about 12.1% per year.This is similarly reflected by the HDB index, which showed a peak of 149.9 during 2Q2013.
Since the index started falling about 28 months ago, it has now reached about 135.2, or about an 11.2% drop in total, or about 4.8% per year.
SPI | Rate of Increase (Decrease) per annum | |
Initial (Jan 2009) | 100 | |
At Peak (April 2013) | 152.3 | 12.1% |
Current | 135.2 | (4.8%) |
A look at the HDB Index reflects a similar trend.
HDB Resale Price Index | Rate of Increase (Decrease) per annum | |
Initial (1Q2009) | 100 | |
At Peak (2Q2013) | 149.4 | 11.0% |
Current | 135 | (4.3%) |
A Moderate Decline In Price Since 2013
There are people who are speculating that HDB resale prices are going to continue is downward trend due to external reasons such as rising interest rate. However, going by the trend, and contrary to what these people might be thinking, prices have already been declining for a period of more than 2 years. Providing an “insight opinion” that prices will drop after it has already fallen isn’t exactly great insight.
In our opinion, while prices may continue to decline for a little while more (1 to 2 years), it would be unrealistic to expect the ongoing fall in prices to continue on its trend for the next 3-4 years.
Also, while prices are declining, it has also been declining at a rate that is far slower than what the initial price increase were between the 4-year periods from 2009 to 2013. And short of an unexpected recession, there is no reason to suggest that this decline will quicken, or last indefinitely.
If you like what you read, subscribe to our DollarsAndSense.sg newsletter. We have more exclusive content written just for it!
The post How Much Are HDB Resale Prices Really Dropping By? appeared first on DollarsAndSense.sg.

 Yahoo Finance

