
 Yahoo Finance
 MTQ (SGX:M05) shareholders have earned a 14% CAGR over the last five years
It hasn't been the best quarter for MTQ Corporation Limited (SGX:M05) shareholders, since the share price has fallen 11% in that time. But that doesn't change the fact that the returns over the last five years have been pleasing. Its return of 70% has certainly bested the market return!
Let's take a look at the underlying fundamentals over the longer term, and see if they've been consistent with shareholders returns.
View our latest analysis for MTQ
To paraphrase Benjamin Graham: Over the short term the market is a voting machine, but over the long term it's a weighing machine. One flawed but reasonable way to assess how sentiment around a company has changed is to compare the earnings per share (EPS) with the share price.
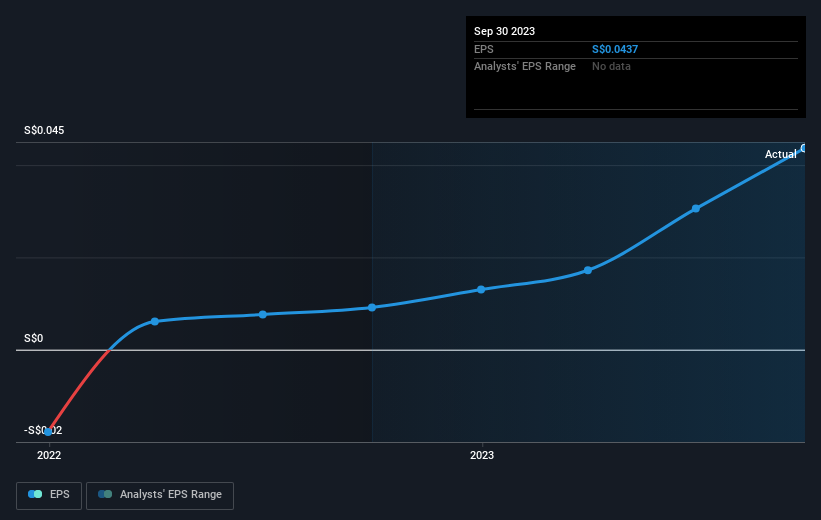
During the five years of share price growth, MTQ moved from a loss to profitability. That's generally thought to be a genuine positive, so we would expect to see an increasing share price. Given that the company made a profit three years ago, but not five years ago, it is worth looking at the share price returns over the last three years, too. Indeed, the MTQ share price has gained 52% in three years. During the same period, EPS grew by 6.9% each year. Notably, the EPS growth has been slower than the annualised share price gain of 15% over three years. So it's fair to assume the market has a higher opinion of the business than it did three years ago.
You can see below how EPS has changed over time (discover the exact values by clicking on the image).
Dive deeper into MTQ's key metrics by checking this interactive graph of MTQ's earnings, revenue and cash flow.
What About Dividends?
As well as measuring the share price return, investors should also consider the total shareholder return (TSR). The TSR incorporates the value of any spin-offs or discounted capital raisings, along with any dividends, based on the assumption that the dividends are reinvested. Arguably, the TSR gives a more comprehensive picture of the return generated by a stock. In the case of MTQ, it has a TSR of 93% for the last 5 years. That exceeds its share price return that we previously mentioned. This is largely a result of its dividend payments!
A Different Perspective
It's nice to see that MTQ shareholders have received a total shareholder return of 32% over the last year. That's including the dividend. That's better than the annualised return of 14% over half a decade, implying that the company is doing better recently. In the best case scenario, this may hint at some real business momentum, implying that now could be a great time to delve deeper. It's always interesting to track share price performance over the longer term. But to understand MTQ better, we need to consider many other factors. For instance, we've identified 4 warning signs for MTQ that you should be aware of.
We will like MTQ better if we see some big insider buys. While we wait, check out this free list of growing companies with considerable, recent, insider buying.
Please note, the market returns quoted in this article reflect the market weighted average returns of stocks that currently trade on Singaporean exchanges.
Have feedback on this article? Concerned about the content? Get in touch with us directly. Alternatively, email editorial-team (at) simplywallst.com.
This article by Simply Wall St is general in nature. We provide commentary based on historical data and analyst forecasts only using an unbiased methodology and our articles are not intended to be financial advice. It does not constitute a recommendation to buy or sell any stock, and does not take account of your objectives, or your financial situation. We aim to bring you long-term focused analysis driven by fundamental data. Note that our analysis may not factor in the latest price-sensitive company announcements or qualitative material. Simply Wall St has no position in any stocks mentioned.
