
 Yahoo Finance
 Morgan Stanley's Dividend Analysis
Assessing the Upcoming Dividend and Historical Performance
Morgan Stanley (NYSE:MS) recently announced a dividend of $0.85 per share, payable on 2024-05-15, with the ex-dividend date set for 2024-04-29. As investors look forward to this upcoming payment, the spotlight also shines on the company's dividend history, yield, and growth rates. Using the data from GuruFocus, let's look into Morgan Stanley's dividend performance and assess its sustainability.
What Does Morgan Stanley Do?
This Powerful Chart Made Peter Lynch 29% A Year For 13 Years
How to calculate the intrinsic value of a stock?
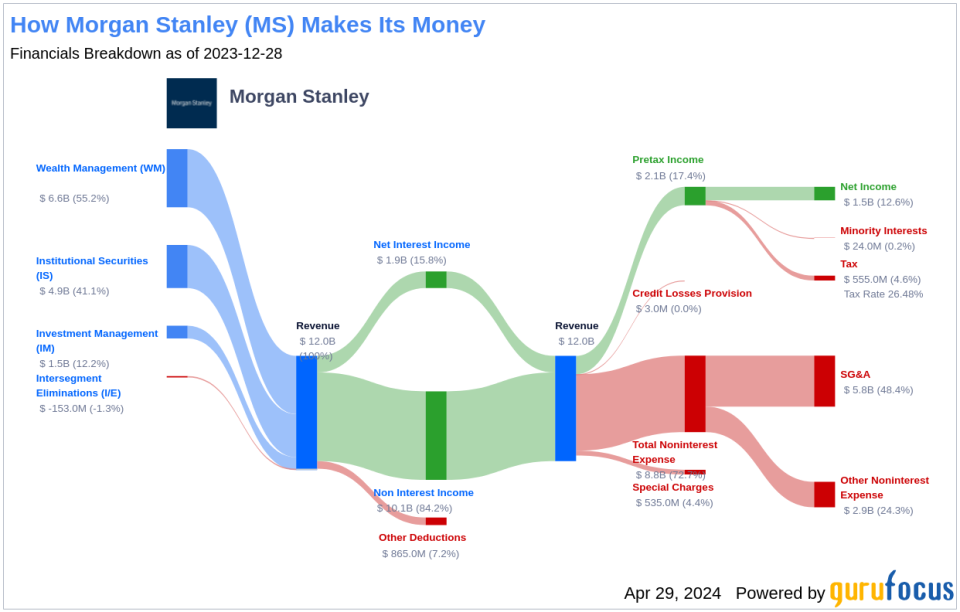
Morgan Stanley is a global investment bank whose history, through its legacy firms, can be traced back to 1924. The company has institutional securities, wealth management, and investment management segments. The company had over $4 trillion of client assets as well as over 80,000 employees at the end of 2022. Approximately 50% of the company's net revenue is from its institutional securities business, with the remainder coming from wealth and investment management. The company derives about 30% of its total revenue outside the Americas.
A Glimpse at Morgan Stanley's Dividend History
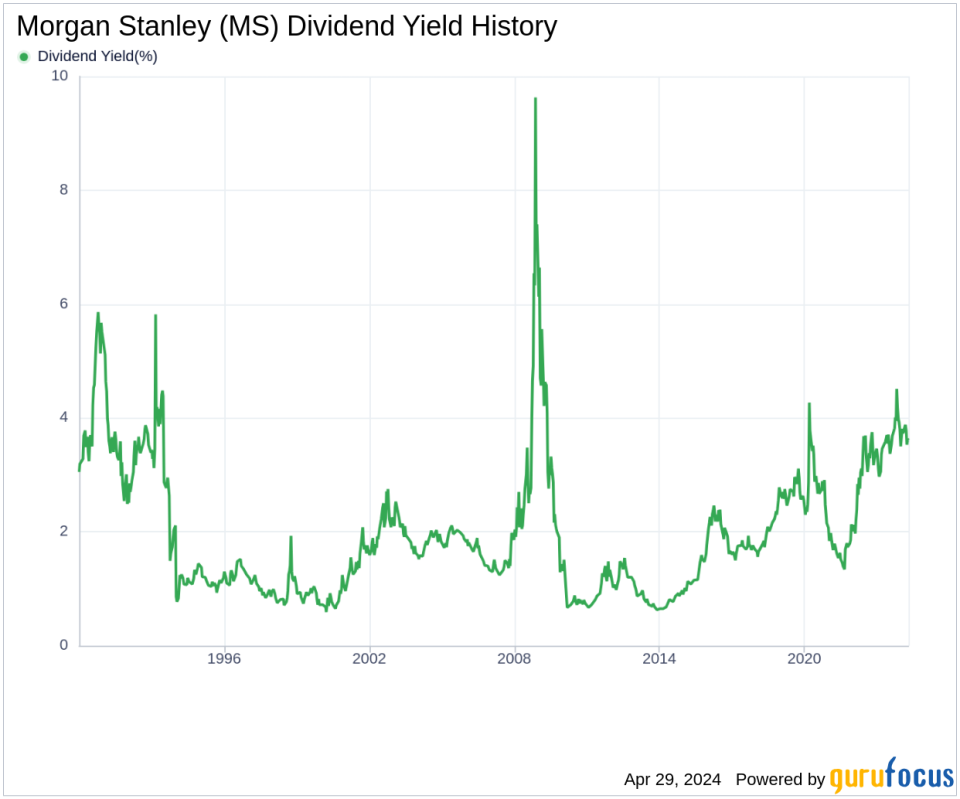
Morgan Stanley has maintained a consistent dividend payment record since 1986. Dividends are currently distributed on a quarterly basis. Morgan Stanley has increased its dividend each year since 2010. The stock is thus listed as a dividend achiever, an honor that is given to companies that have increased their dividend each year for at least the past 14 years. Below is a chart showing annual Dividends Per Share for tracking historical trends.
Breaking Down Morgan Stanley's Dividend Yield and Growth
As of today, Morgan Stanley currently has a 12-month trailing dividend yield of 3.58% and a 12-month forward dividend yield of 3.66%. This suggests an expectation of increased dividend payments over the next 12 months.
Over the past three years, Morgan Stanley's annual dividend growth rate was 32.40%. Extended to a five-year horizon, this rate decreased to 26.70% per year. And over the past decade, Morgan Stanley's annual dividends per share growth rate stands at an impressive 29.30%.
Based on Morgan Stanley's dividend yield and five-year growth rate, the 5-year yield on cost of Morgan Stanley stock as of today is approximately 11.69%.
The Sustainability Question: Payout Ratio and Profitability
To assess the sustainability of the dividend, one needs to evaluate the company's payout ratio. The dividend payout ratio provides insights into the portion of earnings the company distributes as dividends. A lower ratio suggests that the company retains a significant part of its earnings, thereby ensuring the availability of funds for future growth and unexpected downturns. As of 2024-03-31, Morgan Stanley's dividend payout ratio is 0.58.
Morgan Stanley's profitability rank, offers an understanding of the company's earnings prowess relative to its peers. GuruFocus ranks Morgan Stanley's profitability 6 out of 10 as of 2024-03-31, suggesting fair profitability. The company has reported positive net income for each of year over the past decade, further solidifying its high profitability.
Growth Metrics: The Future Outlook
To ensure the sustainability of dividends, a company must have robust growth metrics. Morgan Stanley's growth rank of 6 out of 10 suggests that the company has a fair growth outlook.
Revenue is the lifeblood of any company, and Morgan Stanley's revenue per share, combined with the 3-year revenue growth rate, indicates a strong revenue model. Morgan Stanley's revenue has increased by approximately 2.90% per year on average, a rate that underperforms than approximately 55.07% of global competitors.
The company's 3-year EPS growth rate showcases its capability to grow its earnings, a critical component for sustaining dividends in the long run. During the past three years, Morgan Stanley's earnings increased by approximately -4.50% per year on average, a rate that underperforms than approximately 64.31% of global competitors.
Lastly, the company's 5-year EBITDA growth rate of 5.30%, which underperforms than approximately 63.25% of global competitors.
Next Steps
In conclusion, while Morgan Stanley's dividend payments and growth rates have been impressive historically, the payout ratio and profitability metrics suggest a balanced approach to dividend distribution. The growth outlook, as indicated by revenue and earnings performance, may raise questions about the future pace of dividend increases. However, Morgan Stanley's ability to maintain positive net income and a moderate payout ratio provides some assurance of dividend sustainability. Value investors should weigh these factors carefully when considering Morgan Stanley as a potential addition to their portfolios. GuruFocus Premium users can screen for high-dividend yield stocks using the High Dividend Yield Screener.
This article, generated by GuruFocus, is designed to provide general insights and is not tailored financial advice. Our commentary is rooted in historical data and analyst projections, utilizing an impartial methodology, and is not intended to serve as specific investment guidance. It does not formulate a recommendation to purchase or divest any stock and does not consider individual investment objectives or financial circumstances. Our objective is to deliver long-term, fundamental data-driven analysis. Be aware that our analysis might not incorporate the most recent, price-sensitive company announcements or qualitative information. GuruFocus holds no position in the stocks mentioned herein.
This article first appeared on GuruFocus.
