
 Yahoo Finance
 MEG Energy (TSE:MEG) Is Doing The Right Things To Multiply Its Share Price
If we want to find a potential multi-bagger, often there are underlying trends that can provide clues. Firstly, we'd want to identify a growing return on capital employed (ROCE) and then alongside that, an ever-increasing base of capital employed. If you see this, it typically means it's a company with a great business model and plenty of profitable reinvestment opportunities. So on that note, MEG Energy (TSE:MEG) looks quite promising in regards to its trends of return on capital.
Return On Capital Employed (ROCE): What Is It?
If you haven't worked with ROCE before, it measures the 'return' (pre-tax profit) a company generates from capital employed in its business. To calculate this metric for MEG Energy, this is the formula:
Return on Capital Employed = Earnings Before Interest and Tax (EBIT) ÷ (Total Assets - Current Liabilities)
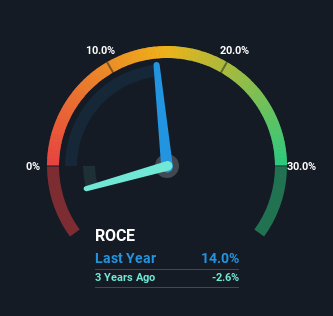
0.14 = CA$885m ÷ (CA$6.9b - CA$584m) (Based on the trailing twelve months to December 2023).
Therefore, MEG Energy has an ROCE of 14%. In absolute terms, that's a satisfactory return, but compared to the Oil and Gas industry average of 9.0% it's much better.
View our latest analysis for MEG Energy
Above you can see how the current ROCE for MEG Energy compares to its prior returns on capital, but there's only so much you can tell from the past. If you'd like, you can check out the forecasts from the analysts covering MEG Energy for free.
The Trend Of ROCE
MEG Energy has not disappointed in regards to ROCE growth. The figures show that over the last five years, returns on capital have grown by 1,002%. That's a very favorable trend because this means that the company is earning more per dollar of capital that's being employed. Interestingly, the business may be becoming more efficient because it's applying 21% less capital than it was five years ago. MEG Energy may be selling some assets so it's worth investigating if the business has plans for future investments to increase returns further still.
Our Take On MEG Energy's ROCE
In a nutshell, we're pleased to see that MEG Energy has been able to generate higher returns from less capital. Since the stock has returned a staggering 374% to shareholders over the last five years, it looks like investors are recognizing these changes. With that being said, we still think the promising fundamentals mean the company deserves some further due diligence.
Like most companies, MEG Energy does come with some risks, and we've found 2 warning signs that you should be aware of.
While MEG Energy may not currently earn the highest returns, we've compiled a list of companies that currently earn more than 25% return on equity. Check out this free list here.
Have feedback on this article? Concerned about the content? Get in touch with us directly. Alternatively, email editorial-team (at) simplywallst.com.
This article by Simply Wall St is general in nature. We provide commentary based on historical data and analyst forecasts only using an unbiased methodology and our articles are not intended to be financial advice. It does not constitute a recommendation to buy or sell any stock, and does not take account of your objectives, or your financial situation. We aim to bring you long-term focused analysis driven by fundamental data. Note that our analysis may not factor in the latest price-sensitive company announcements or qualitative material. Simply Wall St has no position in any stocks mentioned.
