
 Yahoo Finance
 Marks and Spencer Group (LON:MKS) Is Doing The Right Things To Multiply Its Share Price
What are the early trends we should look for to identify a stock that could multiply in value over the long term? In a perfect world, we'd like to see a company investing more capital into its business and ideally the returns earned from that capital are also increasing. Basically this means that a company has profitable initiatives that it can continue to reinvest in, which is a trait of a compounding machine. So when we looked at Marks and Spencer Group (LON:MKS) and its trend of ROCE, we really liked what we saw.
What Is Return On Capital Employed (ROCE)?
For those who don't know, ROCE is a measure of a company's yearly pre-tax profit (its return), relative to the capital employed in the business. To calculate this metric for Marks and Spencer Group, this is the formula:
Return on Capital Employed = Earnings Before Interest and Tax (EBIT) ÷ (Total Assets - Current Liabilities)
0.15 = UK£896m ÷ (UK£8.7b - UK£2.5b) (Based on the trailing twelve months to March 2024).
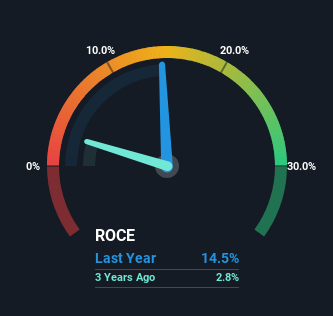
Thus, Marks and Spencer Group has an ROCE of 15%. In absolute terms, that's a pretty normal return, and it's somewhat close to the Consumer Retailing industry average of 17%.
See our latest analysis for Marks and Spencer Group
In the above chart we have measured Marks and Spencer Group's prior ROCE against its prior performance, but the future is arguably more important. If you're interested, you can view the analysts predictions in our free analyst report for Marks and Spencer Group .
So How Is Marks and Spencer Group's ROCE Trending?
Marks and Spencer Group has not disappointed with their ROCE growth. More specifically, while the company has kept capital employed relatively flat over the last five years, the ROCE has climbed 28% in that same time. So it's likely that the business is now reaping the full benefits of its past investments, since the capital employed hasn't changed considerably. It's worth looking deeper into this though because while it's great that the business is more efficient, it might also mean that going forward the areas to invest internally for the organic growth are lacking.
The Bottom Line On Marks and Spencer Group's ROCE
As discussed above, Marks and Spencer Group appears to be getting more proficient at generating returns since capital employed has remained flat but earnings (before interest and tax) are up. And with a respectable 46% awarded to those who held the stock over the last five years, you could argue that these developments are starting to get the attention they deserve. Therefore, we think it would be worth your time to check if these trends are going to continue.
On a final note, we've found 1 warning sign for Marks and Spencer Group that we think you should be aware of.
For those who like to invest in solid companies, check out this free list of companies with solid balance sheets and high returns on equity.
Have feedback on this article? Concerned about the content? Get in touch with us directly. Alternatively, email editorial-team (at) simplywallst.com.
This article by Simply Wall St is general in nature. We provide commentary based on historical data and analyst forecasts only using an unbiased methodology and our articles are not intended to be financial advice. It does not constitute a recommendation to buy or sell any stock, and does not take account of your objectives, or your financial situation. We aim to bring you long-term focused analysis driven by fundamental data. Note that our analysis may not factor in the latest price-sensitive company announcements or qualitative material. Simply Wall St has no position in any stocks mentioned.
