
 Yahoo Finance
 Market Sentiment Around Loss-Making EverCommerce Inc. (NASDAQ:EVCM)
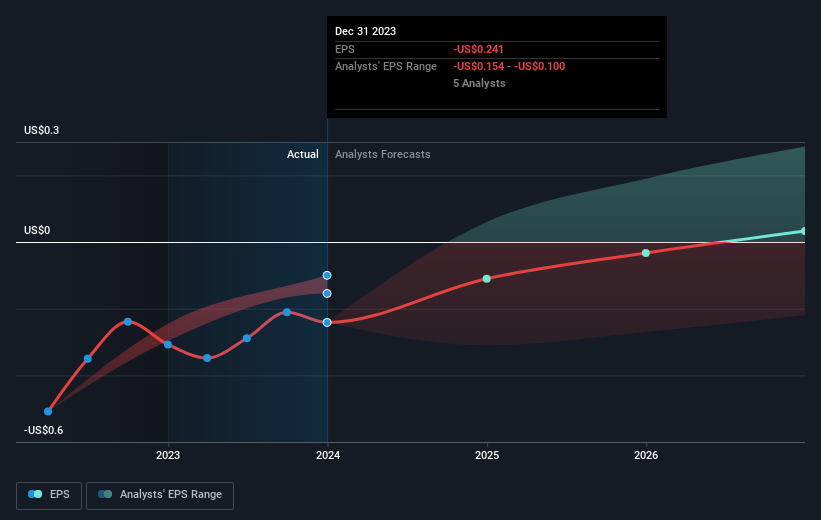
We feel now is a pretty good time to analyse EverCommerce Inc.'s (NASDAQ:EVCM) business as it appears the company may be on the cusp of a considerable accomplishment. EverCommerce Inc., together with its subsidiaries, provides integrated software-as-a-service solutions for service-based small and medium sized businesses in the United States and internationally. On 31 December 2023, the US$1.7b market-cap company posted a loss of US$46m for its most recent financial year. As path to profitability is the topic on EverCommerce's investors mind, we've decided to gauge market sentiment. Below we will provide a high-level summary of the industry analysts’ expectations for the company.
See our latest analysis for EverCommerce
Consensus from 12 of the American Software analysts is that EverCommerce is on the verge of breakeven. They expect the company to post a final loss in 2025, before turning a profit of US$19m in 2026. So, the company is predicted to breakeven approximately 2 years from now. What rate will the company have to grow year-on-year in order to breakeven on this date? Using a line of best fit, we calculated an average annual growth rate of 107%, which signals high confidence from analysts. Should the business grow at a slower rate, it will become profitable at a later date than expected.
Underlying developments driving EverCommerce's growth isn’t the focus of this broad overview, but, bear in mind that generally a high forecast growth rate is not unusual for a company that is currently undergoing an investment period.
One thing we would like to bring into light with EverCommerce is its relatively high level of debt. Generally, the rule of thumb is debt shouldn’t exceed 40% of your equity, which in EverCommerce's case is 65%. Note that a higher debt obligation increases the risk around investing in the loss-making company.
Next Steps:
There are key fundamentals of EverCommerce which are not covered in this article, but we must stress again that this is merely a basic overview. For a more comprehensive look at EverCommerce, take a look at EverCommerce's company page on Simply Wall St. We've also compiled a list of pertinent factors you should further examine:
Valuation: What is EverCommerce worth today? Has the future growth potential already been factored into the price? The intrinsic value infographic in our free research report helps visualize whether EverCommerce is currently mispriced by the market.
Management Team: An experienced management team on the helm increases our confidence in the business – take a look at who sits on EverCommerce’s board and the CEO’s background.
Other High-Performing Stocks: Are there other stocks that provide better prospects with proven track records? Explore our free list of these great stocks here.
Have feedback on this article? Concerned about the content? Get in touch with us directly. Alternatively, email editorial-team (at) simplywallst.com.
This article by Simply Wall St is general in nature. We provide commentary based on historical data and analyst forecasts only using an unbiased methodology and our articles are not intended to be financial advice. It does not constitute a recommendation to buy or sell any stock, and does not take account of your objectives, or your financial situation. We aim to bring you long-term focused analysis driven by fundamental data. Note that our analysis may not factor in the latest price-sensitive company announcements or qualitative material. Simply Wall St has no position in any stocks mentioned.
