
 Yahoo Finance
 Market is not liking Intel's (NASDAQ:INTC) earnings decline as stock retreats 5.8% this week
Many investors define successful investing as beating the market average over the long term. But the risk of stock picking is that you will likely buy under-performing companies. Unfortunately, that's been the case for longer term Intel Corporation (NASDAQ:INTC) shareholders, since the share price is down 42% in the last three years, falling well short of the market return of around 12%. Furthermore, it's down 30% in about a quarter. That's not much fun for holders.
After losing 5.8% this past week, it's worth investigating the company's fundamentals to see what we can infer from past performance.
View our latest analysis for Intel
While markets are a powerful pricing mechanism, share prices reflect investor sentiment, not just underlying business performance. One flawed but reasonable way to assess how sentiment around a company has changed is to compare the earnings per share (EPS) with the share price.
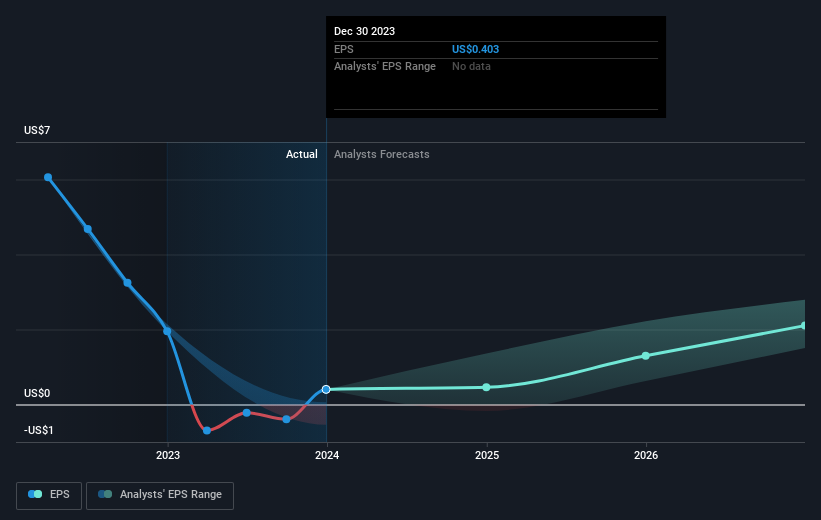
During the three years that the share price fell, Intel's earnings per share (EPS) dropped by 57% each year. This fall in the EPS is worse than the 17% compound annual share price fall. So the market may not be too worried about the EPS figure, at the moment -- or it may have previously priced some of the drop in. This positive sentiment is also reflected in the generous P/E ratio of 86.20.
You can see how EPS has changed over time in the image below (click on the chart to see the exact values).
It's good to see that there was some significant insider buying in the last three months. That's a positive. That said, we think earnings and revenue growth trends are even more important factors to consider. This free interactive report on Intel's earnings, revenue and cash flow is a great place to start, if you want to investigate the stock further.
What About Dividends?
It is important to consider the total shareholder return, as well as the share price return, for any given stock. The TSR incorporates the value of any spin-offs or discounted capital raisings, along with any dividends, based on the assumption that the dividends are reinvested. Arguably, the TSR gives a more comprehensive picture of the return generated by a stock. As it happens, Intel's TSR for the last 3 years was -37%, which exceeds the share price return mentioned earlier. And there's no prize for guessing that the dividend payments largely explain the divergence!
A Different Perspective
Intel shareholders are up 17% for the year (even including dividends). Unfortunately this falls short of the market return. On the bright side, that's still a gain, and it is certainly better than the yearly loss of about 4% endured over half a decade. It could well be that the business is stabilizing. I find it very interesting to look at share price over the long term as a proxy for business performance. But to truly gain insight, we need to consider other information, too. To that end, you should be aware of the 2 warning signs we've spotted with Intel .
There are plenty of other companies that have insiders buying up shares. You probably do not want to miss this free list of growing companies that insiders are buying.
Please note, the market returns quoted in this article reflect the market weighted average returns of stocks that currently trade on American exchanges.
Have feedback on this article? Concerned about the content? Get in touch with us directly. Alternatively, email editorial-team (at) simplywallst.com.
This article by Simply Wall St is general in nature. We provide commentary based on historical data and analyst forecasts only using an unbiased methodology and our articles are not intended to be financial advice. It does not constitute a recommendation to buy or sell any stock, and does not take account of your objectives, or your financial situation. We aim to bring you long-term focused analysis driven by fundamental data. Note that our analysis may not factor in the latest price-sensitive company announcements or qualitative material. Simply Wall St has no position in any stocks mentioned.
