
 Yahoo Finance
 Market Move Approaching: S&P 500, Nasdaq 100 & Dow in View
DailyFX.com -
What’s inside:
The S&P 500 is close to resolving its narrowing range (wedge)
The Nasdaq 100 is postured the strongest, while…
The Dow tight-ropes key trend-line support
Price action points to a material market move, one which could start in the next few days.
On Thursday, we said the S&P 500 is nearing a make or break point, given the period of congestion is narrowing towards an inflection point where something material is likely to happen. A break lower quickly brings the trend-line off the Feb 11 trend-line quickly into play. This will make following a break lower difficult to make a trade on until it clears important slope support along with the Sep 12 low at 2119. Risk of a false break will be elevated in this scenario.
A break higher won’t makes things a heck of a lot easier, as record highs at 2194 will come into focus shortly after a breakout. But at least a break higher would be along the path of least resistance when looking out over the intermediate to long-term.
S&P 500: Daily
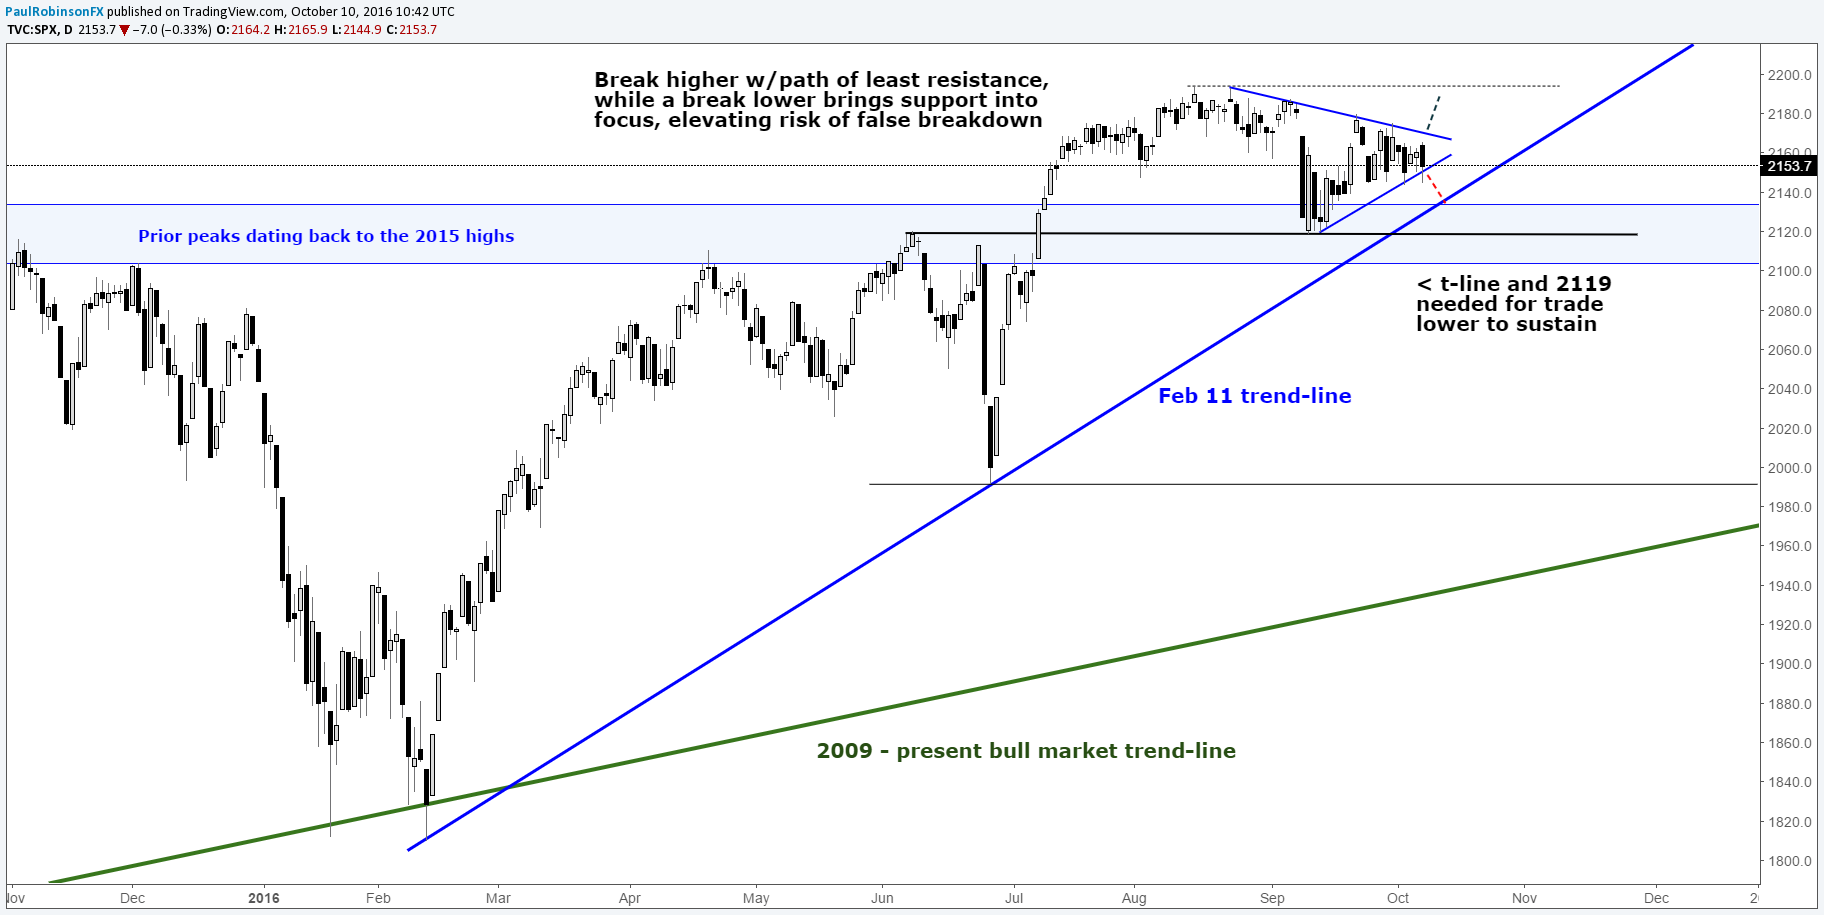
Created in Tradingview
Obviously the other indices are postured similarly, but with varying levels of strength. The Nasdaq 100 is the strongest, while the Dow the weakest.
The Nasdaq is just a stone’s throw from making a break to new record highs, and will likely lead any broad market charge higher. Given the path higher, the trend-line of relevance isn’t the one off the Feb lows, but rather the line off the June lows. The high and tight wedge is only days from intersection with trend support. A break out of the wedge and above 4895 will put focus on the upper parallel dating back to the Feb low. With a break lower we will want to see how the broader S&P reacts at trend-line and September support before becoming aggressive about running with the bears.
Nasdaq 100: Daily

Created in Tradingview
The Dow continues to tight-rope the Feb 11 trend-line, and it will be important for it to start trading up if it is to maintain. Clearance above 18450 will be important on the upside, while the Sep 12 low at 17995 will be significant on a trend-line break. Again, keep any eye on the S&P for confirmation.
Dow: Daily

Created in Tradingview
Check out the DailyFX Q4 market forecasts in our trading guides section.
---Written by Paul Robinson, Market Analyst
To receive Paul’s analysis directly via email, please sign up here.
You can follow Paul on Twitter at @PaulRobinsonFX.
DailyFX provides forex news and technical analysis on the trends that influence the global currency markets.
Learn forex trading with a free practice account and trading charts from FXCM.
