Manufacturing PMI Contracts in February, USDZAR Consolidates
DailyFX.com -
Talking Points:
South Africa’s Trade Deficit increases from R16.55b to R24.22b in January 2015
Kagiso Manufacturing PMI contracts in February; index falls 6.6 points to 47.6
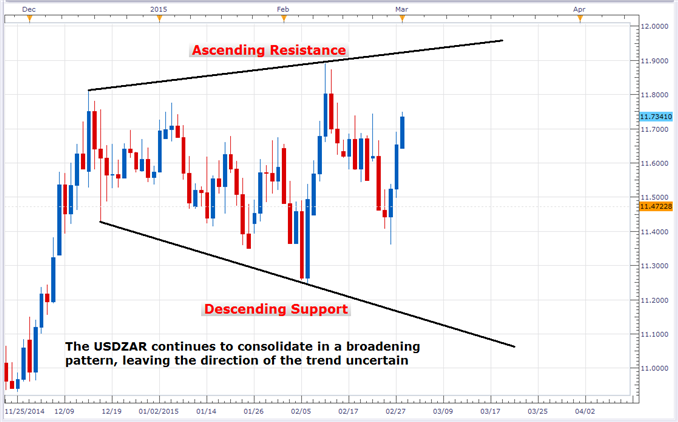
USDZAR continues to consolidate in a broadening pattern
South Africa’s Kagiso Manufacturing PMI drastically fell in February in response to the prior month’s negative trade balance and declining Producer Price Index. The fledging figures are reflected in the value of the rand which has depreciated 3.4% against the US dollar since the data’s release.
The South African Revenue Service reported a trade deficit of R24.22 billion in January, up from the 2014 level R16.55 billion. The shortfall is explained by a 23.1% decrease in exports (valued at R67.08 billion) paired with a 13.3% increase in imports (valued at R91.30 billion). By category, export deficiencies were greatest among the precious metals and stones (-35.4%) as well as vehicles and transport equipment (-27.3%).
Not only was the trade balance deficient in the first month of 2015, but so too were producer prices. The annual percentage change for the price of finished goods in January was 3.5%, well below the 5.8% recorded in December 2014. Accounting for the annual decline, a 6.5% drop in in the price of petroleum, chemical, rubber and plastic products. A similar price movement is identified among 3 out of the 4 subcomponents.
At an annual rate, PPI fell between December and January for the following groups: intermediate manufactured goods (6.1% to 3.4%) mining (+1.8% to -1.7%) and agriculture/forestry/fishing (+2.3% to -1.8%). The exception being electricity and water; prices increased from 8.9% in December to 9.0% in January.
As a result, the aforementioned trade deficit and drop in prices has not instilled confidence in the manufacturing sector. Last month, seasonally adjusted, the index plunged 6.6 points from 54.2 in January to 47.6 in February. As reported by the Bureau of Economic Research, the manufacturing sector is currently strained, as the index now resides below the expansionary 50 level.
Daily USD/ZAR Chart
Chart Created by Walker England Using MarketScope2.0
DailyFX provides forex news and technical analysis on the trends that influence the global currency markets.
Learn forex trading with a free practice account and trading charts from FXCM.

 Yahoo Finance

