
 Yahoo Finance
 Mandarin Oriental International (SGX:M04) Might Be Having Difficulty Using Its Capital Effectively
To find a multi-bagger stock, what are the underlying trends we should look for in a business? In a perfect world, we'd like to see a company investing more capital into its business and ideally the returns earned from that capital are also increasing. Put simply, these types of businesses are compounding machines, meaning they are continually reinvesting their earnings at ever-higher rates of return. Although, when we looked at Mandarin Oriental International (SGX:M04), it didn't seem to tick all of these boxes.
What Is Return On Capital Employed (ROCE)?
If you haven't worked with ROCE before, it measures the 'return' (pre-tax profit) a company generates from capital employed in its business. To calculate this metric for Mandarin Oriental International, this is the formula:
Return on Capital Employed = Earnings Before Interest and Tax (EBIT) ÷ (Total Assets - Current Liabilities)
0.019 = US$65m ÷ (US$4.2b - US$759m) (Based on the trailing twelve months to June 2023).
So, Mandarin Oriental International has an ROCE of 1.9%. In absolute terms, that's a low return and it also under-performs the Hospitality industry average of 3.9%.
View our latest analysis for Mandarin Oriental International
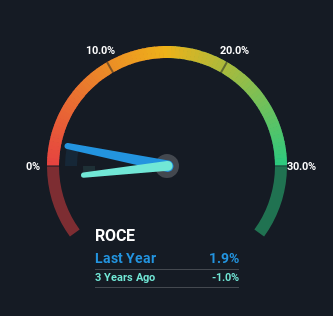
Historical performance is a great place to start when researching a stock so above you can see the gauge for Mandarin Oriental International's ROCE against it's prior returns. If you want to delve into the historical earnings, revenue and cash flow of Mandarin Oriental International, check out these free graphs here.
How Are Returns Trending?
On the surface, the trend of ROCE at Mandarin Oriental International doesn't inspire confidence. Around five years ago the returns on capital were 4.5%, but since then they've fallen to 1.9%. Although, given both revenue and the amount of assets employed in the business have increased, it could suggest the company is investing in growth, and the extra capital has led to a short-term reduction in ROCE. And if the increased capital generates additional returns, the business, and thus shareholders, will benefit in the long run.
The Key Takeaway
While returns have fallen for Mandarin Oriental International in recent times, we're encouraged to see that sales are growing and that the business is reinvesting in its operations. These growth trends haven't led to growth returns though, since the stock has fallen 18% over the last five years. As a result, we'd recommend researching this stock further to uncover what other fundamentals of the business can show us.
If you want to continue researching Mandarin Oriental International, you might be interested to know about the 1 warning sign that our analysis has discovered.
While Mandarin Oriental International isn't earning the highest return, check out this free list of companies that are earning high returns on equity with solid balance sheets.
Have feedback on this article? Concerned about the content? Get in touch with us directly. Alternatively, email editorial-team (at) simplywallst.com.
This article by Simply Wall St is general in nature. We provide commentary based on historical data and analyst forecasts only using an unbiased methodology and our articles are not intended to be financial advice. It does not constitute a recommendation to buy or sell any stock, and does not take account of your objectives, or your financial situation. We aim to bring you long-term focused analysis driven by fundamental data. Note that our analysis may not factor in the latest price-sensitive company announcements or qualitative material. Simply Wall St has no position in any stocks mentioned.
