
 Yahoo Finance
 MakeMyTrip (NASDAQ:MMYT) Is Experiencing Growth In Returns On Capital
Did you know there are some financial metrics that can provide clues of a potential multi-bagger? One common approach is to try and find a company with returns on capital employed (ROCE) that are increasing, in conjunction with a growing amount of capital employed. If you see this, it typically means it's a company with a great business model and plenty of profitable reinvestment opportunities. With that in mind, we've noticed some promising trends at MakeMyTrip (NASDAQ:MMYT) so let's look a bit deeper.
What Is Return On Capital Employed (ROCE)?
For those that aren't sure what ROCE is, it measures the amount of pre-tax profits a company can generate from the capital employed in its business. The formula for this calculation on MakeMyTrip is:
Return on Capital Employed = Earnings Before Interest and Tax (EBIT) ÷ (Total Assets - Current Liabilities)
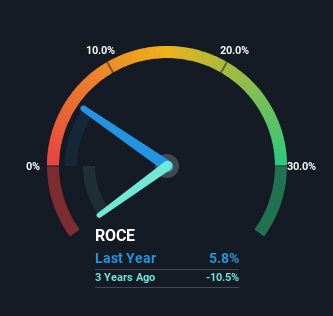
0.058 = US$56m ÷ (US$1.5b - US$547m) (Based on the trailing twelve months to December 2023).
Thus, MakeMyTrip has an ROCE of 5.8%. In absolute terms, that's a low return and it also under-performs the Hospitality industry average of 9.6%.
See our latest analysis for MakeMyTrip
In the above chart we have measured MakeMyTrip's prior ROCE against its prior performance, but the future is arguably more important. If you'd like to see what analysts are forecasting going forward, you should check out our free analyst report for MakeMyTrip .
How Are Returns Trending?
Like most people, we're pleased that MakeMyTrip is now generating some pretax earnings. Historically the company was generating losses but as we can see from the latest figures referenced above, they're now earning 5.8% on their capital employed. In regards to capital employed, MakeMyTrip is using 30% less capital than it was five years ago, which on the surface, can indicate that the business has become more efficient at generating these returns. This could potentially mean that the company is selling some of its assets.
For the record though, there was a noticeable increase in the company's current liabilities over the period, so we would attribute some of the ROCE growth to that. The current liabilities has increased to 36% of total assets, so the business is now more funded by the likes of its suppliers or short-term creditors. Keep an eye out for future increases because when the ratio of current liabilities to total assets gets particularly high, this can introduce some new risks for the business.
The Key Takeaway
In summary, it's great to see that MakeMyTrip has been able to turn things around and earn higher returns on lower amounts of capital. And with the stock having performed exceptionally well over the last five years, these patterns are being accounted for by investors. Therefore, we think it would be worth your time to check if these trends are going to continue.
On a separate note, we've found 1 warning sign for MakeMyTrip you'll probably want to know about.
For those who like to invest in solid companies, check out this free list of companies with solid balance sheets and high returns on equity.
Have feedback on this article? Concerned about the content? Get in touch with us directly. Alternatively, email editorial-team (at) simplywallst.com.
This article by Simply Wall St is general in nature. We provide commentary based on historical data and analyst forecasts only using an unbiased methodology and our articles are not intended to be financial advice. It does not constitute a recommendation to buy or sell any stock, and does not take account of your objectives, or your financial situation. We aim to bring you long-term focused analysis driven by fundamental data. Note that our analysis may not factor in the latest price-sensitive company announcements or qualitative material. Simply Wall St has no position in any stocks mentioned.
