
 Yahoo Finance
 JPN225 Technical Analysis: 2-Year Low Under Threat
DailyFX.com -
Talking Points:
Nikkei 225 Strategy: Dip buyers be cautious if index challenges 2-year low
Immediate support is 14,963, followed by 2-year low at 14,353
Clear downtrend still dominates price action
As forewarned, JPN 225 broke below 76.4% Fibonacci at 15,545 to test a past support at 14,963. Below that, the 2-year low at 14,353 has come under threat. A breach of this level would be bad sign for the bulls and dip buyers.
Traders who look to buy dips should exercise caution during the rest of this week, especially if JPN drops further toward the 2-year low. Momentum signals remain in oversold zone with no sign to pick up yet.
On the topside, 76.4% Fibonacci now turns into an immediate resistance, topped by 50% Fibonacci at 17,416. Below is weekly chart for a broader view of the index.
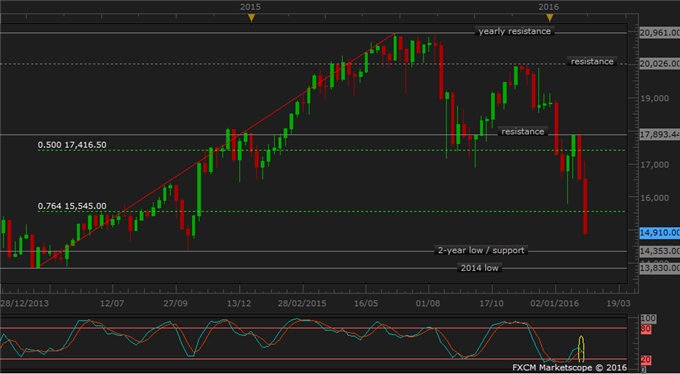
Weekly Chart - Created Using FXCM Marketscope
Need a hand to start trading:Free Guides

Daily Chart - Created Using FXCM Marketscope
Losing Money Trading Forex? This Might Be Why.
Want to read market’s momentum: Speculative Sentiment Index
--- Written by Nathalie Huynh, Strategist for DailyFX.com
Contact and follow Nathalie on Twitter: @nathuynh
DailyFX provides forex news and technical analysis on the trends that influence the global currency markets.
Learn forex trading with a free practice account and trading charts from FXCM.