
 Yahoo Finance
 John Wiley (JW.A) Q2 Earnings Top Estimates, Revenues Miss
John Wiley & Sons, Inc. JW.A released second-quarter fiscal 2020 results, wherein earnings comfortably beat the Zacks Consensus Estimate but revenues missed the same. However, revenues grew year over year, backed by strong Research Publishing & Platforms and Education Services segments. Notably, shares of the company gained 1.8% on Dec 4.
In fact, this Zacks Rank #3 (Hold) stock has gained 6.6% in the past three months compared with the industry’s growth of 4.2%.
Q2 in Detail
John Wiley’s adjusted earnings of 85 cents per share fell 4.5% year over year and 1% on a constant-currency (cc) basis. The downside can be attributable to increased interest expenses. Nonetheless, the bottom line surpassed the Zacks Consensus Estimate of 67 cents.
John Wiley & Sons, Inc. Price, Consensus and EPS Surprise
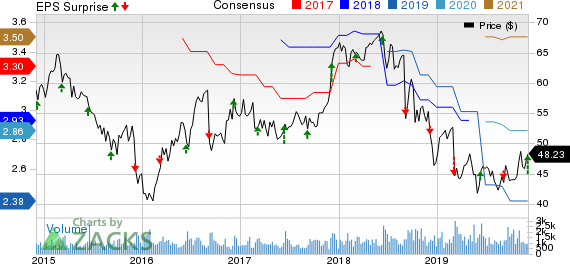
John Wiley & Sons, Inc. price-consensus-eps-surprise-chart | John Wiley & Sons, Inc. Quote
Revenues of $466.2 million advanced 3.9% year over year (up 5% at cc), though it fell short of the Zacks Consensus Estimate of $471 million. Revenues in the quarter were backed by contributions from our Learning House, Knewton and zyBooks buyouts. Excluding these, organic revenues slipped 1%. Strength in Research Publishing & Platforms and Education Services was partly countered by weakness in the Academic & Professional Learning division.
Adjusted operating income was flat year over year at $67.4 million, owing to growth and optimization initiatives. Adjusted EBITDA rose 2.7% (3% at cc) to $110 million.
Segmental Details
The Research Publishing & Platforms segment consists of Research Publishing and Research Platforms businesses. In the second quarter, revenues grew 2% year over year (up 4% at cc) to $234.7 million on higher open access publishing volumes. Research Publishing grew 2% and Research Platforms increased 3%. The segment’s adjusted contribution to profit rose 4% at cc.
The Academic & Professional Learning segment includes the Education Publishing and Professional Learning businesses. Revenues in the segment dropped 6% on a reported basis and 5% at cc to $177.7 million due to weakness in book publishing, somewhat compensated by improvements at test preparation. Further, excluding contributions from the acquisitions of zyBooks and Knewton, organic revenues declined 10% (down 9% at cc). Adjusted contribution to profit slumped 26% at cc during the quarter under review.
Management expects Academic & Professional Learning revenues to decline low-single digits in fiscal 2020 due to weakness in book publishing, particularly traditional books.
The Education Services revenues surged 80% on a reported basis and at cc. The upside was backed by gains from the Learning House buyout as well as a 10% rise in organic revenues. Also, adjusted contribution to profit from the segment improved considerably.
Other Financial Update
John Wiley ended the quarter with cash and cash equivalents of $107.7 million, long-term debt of $788.4 million and total shareholders’ equity of $1,179 million.
The company used $99.5 million of cash in operating activities in the first half of fiscal 2020. Further, it used free cash flow (net of Product Development Spending) of roughly $155.7 million. For fiscal 2020, the company still anticipates free cash flow of $210-$230 million.
During the second quarter, John Wiley bought back 334,336 shares for $15 million and paid out cash dividends of $19 million.
Guidance
Management reiterated its fiscal 2020 view. The company anticipates revenues for fiscal 2020 in the range of $1,855-$1,885 million. John Wiley still expects adjusted EBITDA of $357-$372 million and adjusted earnings per share of $2.35-$2.45. The mid-point of $2.40 stands above the current Zacks Consensus Estimate for earnings of $2.38.
Don’t Miss These Solid Consumer Staple Stocks
Boston Beer SAM, with a Zacks Rank #1 (Strong Buy), has a long-term earnings per share growth rate of 10%. You can see the complete list of today’s Zacks #1 Rank stocks here.
Beyond Meat BYND, with a Zacks Rank #2 (Buy), has an impressive earnings surprise record.
Newell Brands NWL, also with a Zacks Rank #2, has a long-term earnings per share growth rate of 6%.
More Stock News: This Is Bigger than the iPhone!
It could become the mother of all technological revolutions. Apple sold a mere 1 billion iPhones in 10 years but a new breakthrough is expected to generate more than 27 billion devices in just 3 years, creating a $1.7 trillion market.
Zacks has just released a Special Report that spotlights this fast-emerging phenomenon and 6 tickers for taking advantage of it. If you don't buy now, you may kick yourself in 2020.
Click here for the 6 trades >>
Want the latest recommendations from Zacks Investment Research? Today, you can download 7 Best Stocks for the Next 30 Days. Click to get this free report
Newell Brands Inc. (NWL) : Free Stock Analysis Report
The Boston Beer Company, Inc. (SAM) : Free Stock Analysis Report
John Wiley & Sons, Inc. (JW.A) : Free Stock Analysis Report
Beyond Meat, Inc. (BYND) : Free Stock Analysis Report
To read this article on Zacks.com click here.
