
 Yahoo Finance
 ISDN Holdings (SGX:I07) Could Be Struggling To Allocate Capital
If you're not sure where to start when looking for the next multi-bagger, there are a few key trends you should keep an eye out for. Firstly, we'd want to identify a growing return on capital employed (ROCE) and then alongside that, an ever-increasing base of capital employed. Ultimately, this demonstrates that it's a business that is reinvesting profits at increasing rates of return. Having said that, from a first glance at ISDN Holdings (SGX:I07) we aren't jumping out of our chairs at how returns are trending, but let's have a deeper look.
Understanding Return On Capital Employed (ROCE)
If you haven't worked with ROCE before, it measures the 'return' (pre-tax profit) a company generates from capital employed in its business. To calculate this metric for ISDN Holdings, this is the formula:
Return on Capital Employed = Earnings Before Interest and Tax (EBIT) ÷ (Total Assets - Current Liabilities)
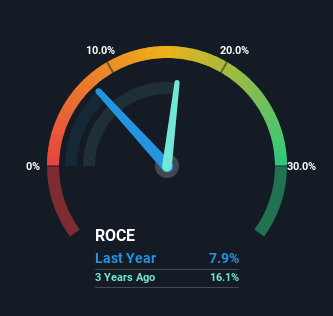
0.079 = S$24m ÷ (S$400m - S$98m) (Based on the trailing twelve months to December 2023).
Therefore, ISDN Holdings has an ROCE of 7.9%. Even though it's in line with the industry average of 8.2%, it's still a low return by itself.
See our latest analysis for ISDN Holdings
Above you can see how the current ROCE for ISDN Holdings compares to its prior returns on capital, but there's only so much you can tell from the past. If you'd like, you can check out the forecasts from the analysts covering ISDN Holdings for free.
What Can We Tell From ISDN Holdings' ROCE Trend?
On the surface, the trend of ROCE at ISDN Holdings doesn't inspire confidence. Over the last five years, returns on capital have decreased to 7.9% from 13% five years ago. Meanwhile, the business is utilizing more capital but this hasn't moved the needle much in terms of sales in the past 12 months, so this could reflect longer term investments. It's worth keeping an eye on the company's earnings from here on to see if these investments do end up contributing to the bottom line.
The Key Takeaway
Bringing it all together, while we're somewhat encouraged by ISDN Holdings' reinvestment in its own business, we're aware that returns are shrinking. And investors may be recognizing these trends since the stock has only returned a total of 36% to shareholders over the last five years. Therefore, if you're looking for a multi-bagger, we'd propose looking at other options.
If you want to continue researching ISDN Holdings, you might be interested to know about the 2 warning signs that our analysis has discovered.
For those who like to invest in solid companies, check out this free list of companies with solid balance sheets and high returns on equity.
Have feedback on this article? Concerned about the content? Get in touch with us directly. Alternatively, email editorial-team (at) simplywallst.com.
This article by Simply Wall St is general in nature. We provide commentary based on historical data and analyst forecasts only using an unbiased methodology and our articles are not intended to be financial advice. It does not constitute a recommendation to buy or sell any stock, and does not take account of your objectives, or your financial situation. We aim to bring you long-term focused analysis driven by fundamental data. Note that our analysis may not factor in the latest price-sensitive company announcements or qualitative material. Simply Wall St has no position in any stocks mentioned.
