
 Yahoo Finance
 Is IRC Limited’s (HKG:1029) Balance Sheet A Threat To Its Future?

Investors are always looking for growth in small-cap stocks like IRC Limited (SEHK:1029), with a market cap of HK$1.03B. However, an important fact which most ignore is: how financially healthy is the business? So, understanding the company’s financial health becomes crucial, as mismanagement of capital can lead to bankruptcies, which occur at a higher rate for small-caps. Here are a few basic checks that are good enough to have a broad overview of the company’s financial strength. Nevertheless, given that I have not delve into the company-specifics, I suggest you dig deeper yourself into 1029 here.
Does 1029 generate an acceptable amount of cash through operations?
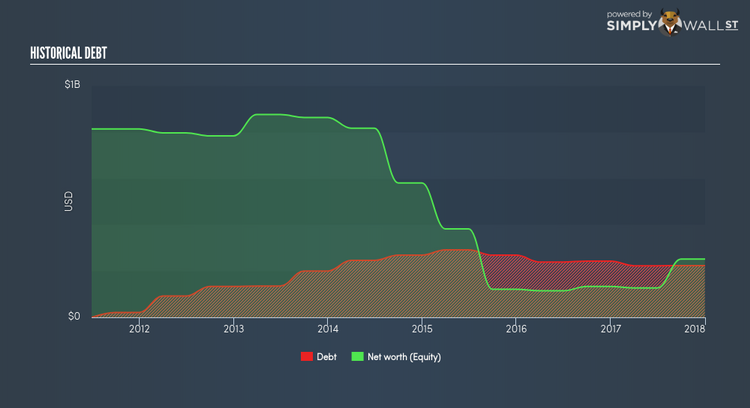
1029’s debt levels have fallen from US$242.98M to US$223.03M over the last 12 months – this includes both the current and long-term debt. With this reduction in debt, 1029’s cash and short-term investments stands at US$9.00M , ready to deploy into the business. On top of this, 1029 has produced US$21.56M in operating cash flow over the same time period, leading to an operating cash to total debt ratio of 9.67%, meaning that 1029’s operating cash is not sufficient to cover its debt. This ratio can also be interpreted as a measure of efficiency as an alternative to return on assets. In 1029’s case, it is able to generate 0.097x cash from its debt capital.
Can 1029 meet its short-term obligations with the cash in hand?
With current liabilities at US$99.04M, it appears that the company has not maintained a sufficient level of current assets to meet its obligations, with the current ratio last standing at 0.64x, which is below the prudent industry ratio of 3x.
Can 1029 service its debt comfortably?
With debt reaching 88.70% of equity, 1029 may be thought of as relatively highly levered. This is not uncommon for a small-cap company given that debt tends to be lower-cost and at times, more accessible. We can check to see whether 1029 is able to meet its debt obligations by looking at the net interest coverage ratio. A company generating earnings before interest and tax (EBIT) at least three times its net interest payments is considered financially sound. In 1029’s, case, the ratio of less than 0.1x suggests is not appropriately covered lenders may be more reluctant to lend out more funding as 1029’s low interest coverage already puts the company at higher risk of default.
Next Steps:
1029’s high debt level indicates room for improvement. Furthermore, its cash flow coverage of less than a quarter of debt means that operating efficiency could also be an issue. In addition to this, its lack of liquidity raises questions over current asset management practices for the small-cap. Keep in mind I haven’t considered other factors such as how 1029 has been performing in the past. You should continue to research IRC to get a more holistic view of the stock by looking at:
Valuation: What is 1029 worth today? Is the stock undervalued, even when its growth outlook is factored into its intrinsic value? The intrinsic value infographic in our free research report helps visualize whether 1029 is currently mispriced by the market.
Historical Performance: What has 1029’s returns been like over the past? Go into more detail in the past track record analysis and take a look at the free visual representations of our analysis for more clarity.
Other High-Performing Stocks: Are there other stocks that provide better prospects with proven track records? Explore our free list of these great stocks here.
To help readers see pass the short term volatility of the financial market, we aim to bring you a long-term focused research analysis purely driven by fundamental data. Note that our analysis does not factor in the latest price sensitive company announcements.
The author is an independent contributor and at the time of publication had no position in the stocks mentioned.
