
 Yahoo Finance
 Investors in Xunlei (NASDAQ:XNET) have unfortunately lost 70% over the last three years
As every investor would know, not every swing hits the sweet spot. But really big losses can really drag down an overall portfolio. So spare a thought for the long term shareholders of Xunlei Limited (NASDAQ:XNET); the share price is down a whopping 70% in the last three years. That would be a disturbing experience. But it's up 6.1% in the last week. Less than a week ago Xunlei announced its financial results; you can catch up on the most recent data by reading our company report.
With that in mind, it's worth seeing if the company's underlying fundamentals have been the driver of long term performance, or if there are some discrepancies.
Check out our latest analysis for Xunlei
To paraphrase Benjamin Graham: Over the short term the market is a voting machine, but over the long term it's a weighing machine. One imperfect but simple way to consider how the market perception of a company has shifted is to compare the change in the earnings per share (EPS) with the share price movement.
Xunlei became profitable within the last five years. That would generally be considered a positive, so we are surprised to see the share price is down. So given the share price is down it's worth checking some other metrics too.
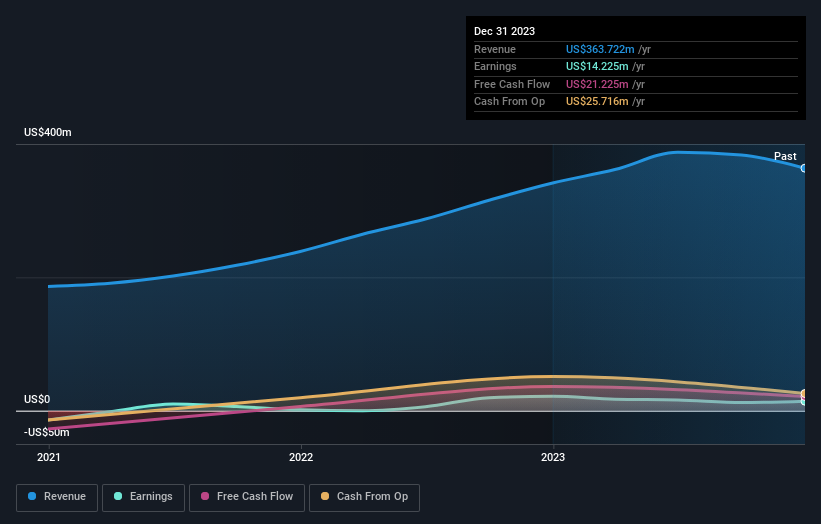
We note that, in three years, revenue has actually grown at a 26% annual rate, so that doesn't seem to be a reason to sell shares. It's probably worth investigating Xunlei further; while we may be missing something on this analysis, there might also be an opportunity.
The graphic below depicts how earnings and revenue have changed over time (unveil the exact values by clicking on the image).
This free interactive report on Xunlei's balance sheet strength is a great place to start, if you want to investigate the stock further.
A Different Perspective
Xunlei shareholders are down 0.6% for the year, but the market itself is up 24%. However, keep in mind that even the best stocks will sometimes underperform the market over a twelve month period. Unfortunately, longer term shareholders are suffering worse, given the loss of 9% doled out over the last five years. We would want clear information suggesting the company will grow, before taking the view that the share price will stabilize. I find it very interesting to look at share price over the long term as a proxy for business performance. But to truly gain insight, we need to consider other information, too. Consider risks, for instance. Every company has them, and we've spotted 1 warning sign for Xunlei you should know about.
We will like Xunlei better if we see some big insider buys. While we wait, check out this free list of growing companies with considerable, recent, insider buying.
Please note, the market returns quoted in this article reflect the market weighted average returns of stocks that currently trade on American exchanges.
Have feedback on this article? Concerned about the content? Get in touch with us directly. Alternatively, email editorial-team (at) simplywallst.com.
This article by Simply Wall St is general in nature. We provide commentary based on historical data and analyst forecasts only using an unbiased methodology and our articles are not intended to be financial advice. It does not constitute a recommendation to buy or sell any stock, and does not take account of your objectives, or your financial situation. We aim to bring you long-term focused analysis driven by fundamental data. Note that our analysis may not factor in the latest price-sensitive company announcements or qualitative material. Simply Wall St has no position in any stocks mentioned.
